
Last year was particularly good in terms of performance for one of the concepts tracked by our thematic indices family: artificial intelligence (AI).
Qontigo has two approaches to track the beneficiaries of AI technologies. The STOXX® Global Artificial Intelligence Index (Global AI Index) selects companies with the highest revenue exposure to AI, based on FactSet’s Revere industry hierarchy.
The STOXX® AI Global Artificial Intelligence Index (AI Global AI Index), on the other hand, picks companies investing in the development and adoption of AI-related intellectual property, via an innovative selection process that relies itself on machine-learning techniques. STOXX has partnered up with Yewno, whose knowledge-graph algorithm detects which awarded patents worldwide relate to AI. As such, the AI Global AI Index was upon launch the first thematic index to select its constituents by means of AI technology.
Investors have, then, two alternatives: gaining exposure to a basket of companies that are already raising the most revenue from AI technologies, or investing in businesses that are spending in AI research and development. The Global AI Index selects companies from focused sectors, while the AI Global AI Index looks forward and offers exposure to the future value of current investments to reap the benefits of a long-term megatrend.
A third index, the STOXX® AI Global AI ADTV5 Index, is a version of the AI Global AI Index that implements a minimum daily trading value screen to select its constituents.
Stellar run for technology
As information technology and autonomous machines develop at fast pace, investors are seeking to profit from AI’s economic impact. AI is one of several large cross-industry concepts that fall, according to Qontigo’s view, within the broader technology megatrend. We see two other megatrends: demographics and climate change.
The revenues-based Global AI Index, in particular, has a significant weight towards bellwether US technology stocks, which performed very strongly in recent years. That includes Alphabet, Facebook, Nvidia and Intel.
Chart 1 compares the performance of the three AI indices between Mar. 18, 2013, when data is first available for all three gauges, through last year. Featured as well is their parent universe benchmark, the STOXX® Developed and Emerging Markets Total Market Index.
Chart 1 – Performance 2013 – 2019.
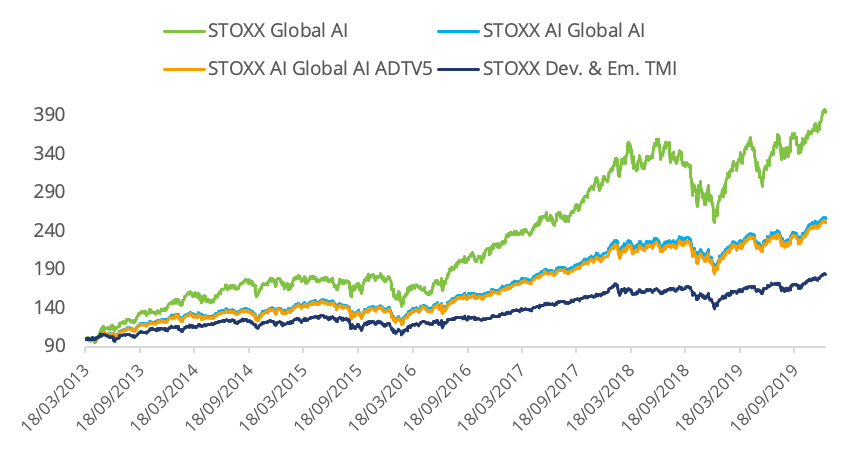
The revenue-based Global AI Index stands out for its performance, having trebled in value between 2013 and 2019. The patents-based AI indices also outperformed the benchmark, to the tune of 70 percentage points through last year.
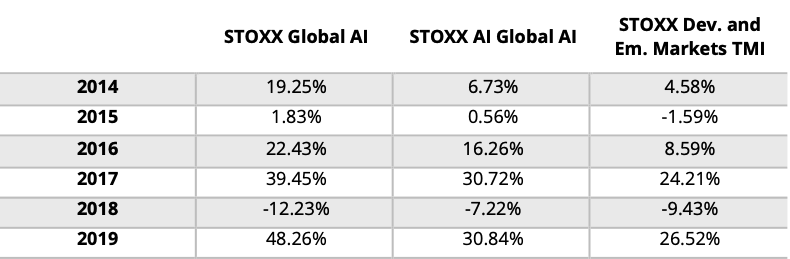
Table 1 shows the performance of the two main AI indices against the STOXX Developed and Emerging Markets Total Market Index.
Both AI indices did better than their universe benchmark every year with the exception of 2018, when the tech-tilted revenues-based Global AI Index was impacted the most by that year’s late sell-off.
Table 1
In 2020, markets have been rattled by the spread of the COVID-19 virus, so the trend may not persist. Should the volatility seen in February and March this year persist, a performance analysis of the AI indices would be warranted to understand the drivers and factors behind the returns.
Risk-adjusted returns
Yet absolute returns show only part of the story. Qontigo’s three AI indices have been designed to offer investors two different approaches to stock selection. The resulting portfolios are, therefore, quite different from each other.
Table 2 looks at the fundamental risk and return characteristics of the two main AI indices against their universe benchmark.
Table 2
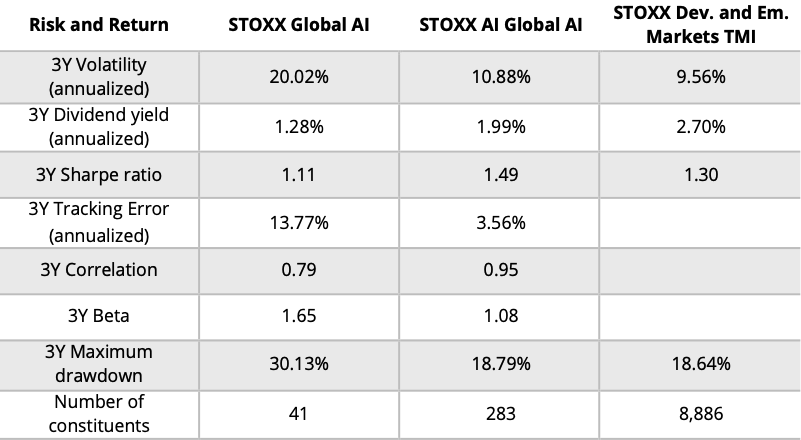
Table 2 shows that the risk-and-return profile of the two main AI indices is actually quite different despite making up a portfolio with exposure to a same theme. The patents-based AI Global AI Index has higher risk-adjusted returns, a result of having lower volatility while still maintaining a relatively strong performance. The index also tracks the universe benchmark more closely and offers a higher dividend yield than the revenue-based AI index.
AI ‘pure plays’ and AI beneficiaries
In trying to identify the reasons behind the divergence in volatility profiles of the two main AI indices, some fundamental characteristics stand out that may help explain this situation.
First is the number of components. A notably larger pool of stocks in the patents-based index suggests that, all other things equal, risk is more diversified as a result of spreading the eggs in more baskets.
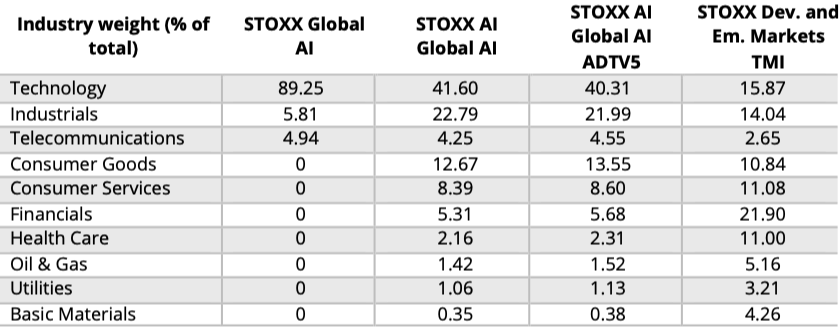
Furthermore, the indices also show a different profile in terms of industry allocation. As mentioned, the revenue-based Global AI Index is heavily weighted towards the technology sector. The AI Global AI indices, however, have exposure to nine other industries (Table 3).
This is because the patents-based AI Index tracks companies from across the business spectrum that are incorporating AI in their models, eventually improving operational costs and income. This may include, for example, banks implementing AI for customer authentication, fraud prevention or regulatory checks; or industrial companies doing so to improve manufacturing efficiency. These are not direct or ‘pure play’ AI stocks but stand to benefit from the technology.
For example, JP Morgan Chase announced in February that the incorporation of intelligence into its business via AI and machine learning will be one of the pillars to enhance productivity and quality of services in its investment-bank unit. The stock is part of the patents-based AI Global AI Index but is not in the revenue-based Global AI Index, as JP Morgan’s revenues are derived from activities related to finance.
Table 3
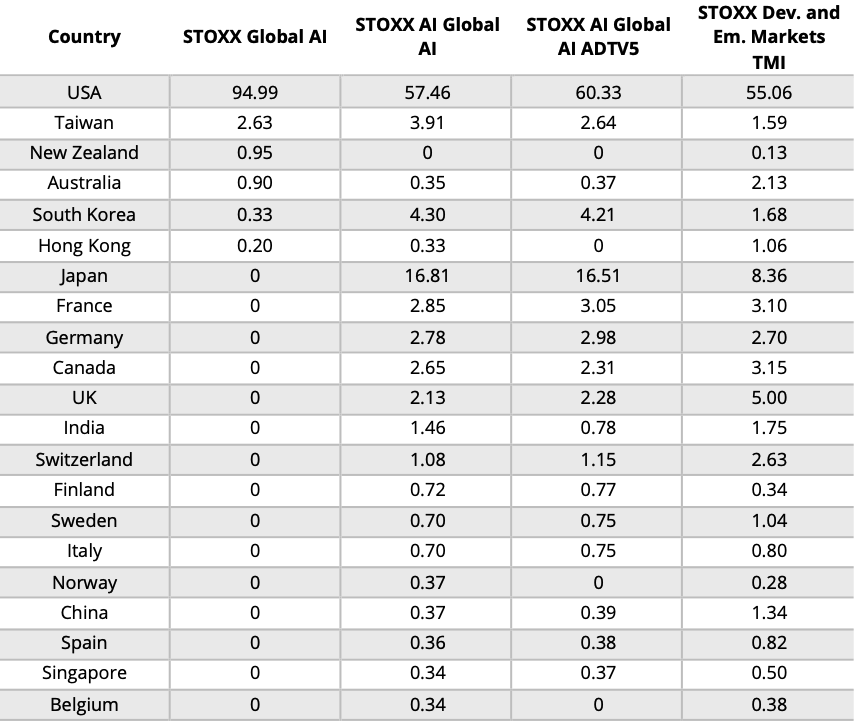
The main AI Global AI index also shows higher geographic diversification. While nearly 58% of its constituents are US-based, that ratio jumps to 95% for the Global AI index (Table 4). This may suggest American companies are leaders in the provision of AI technologies, but that the rest of the world has grasped the importance of AI in improving operational efficiencies and is investing in incorporating the technology into business models.
Table 4
The diverse profiles also result in different fundamental ratios for the indices. The AI Global AI index trades at 19 times expected earnings (excluding negative estimates), and 2.2 times its members’ book value.1 Those ratios appear higher for the Global AI index: 28.6 and 5.3, respectively.
Worth noting is the different weighting methodology. The patents-based AI Global AI index is equally weighted, meaning it allocates the same resources to all members regardless of size. The revenue-based Global AI index is weighted by the free-float market cap of the selected stocks multiplied by their sales exposure to AI, with caps to those weightings. Member composition is reviewed quarterly in the former and annually in the latter.
Market sell-off and price dislocation
To be sure, trading so far this year has altered the return picture for all three indices — a trend in line with price dislocations elsewhere as equity indices sharply entered in March their first bear market in over a decade.
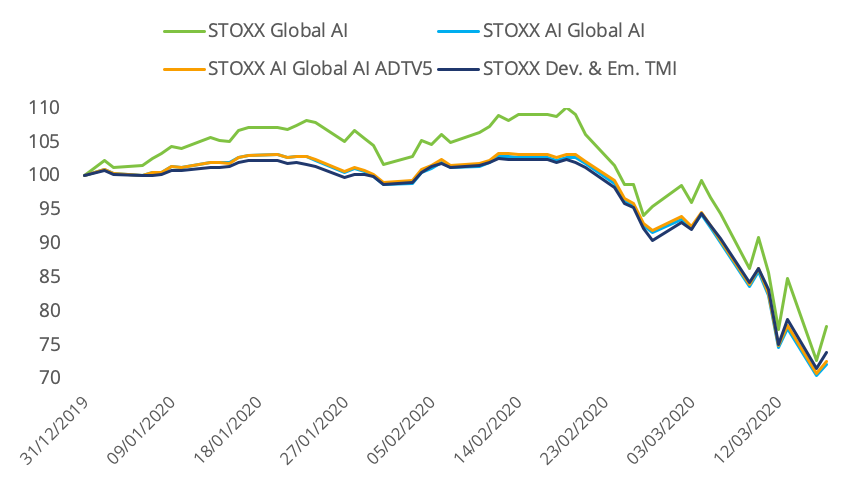
Capturing the performance since the start of 2020, Chart 2 shows that the patents-based artificial intelligence indices have fallen only slightly more than the benchmark. The revenue-based Global AI Index has maintained its outperformance, courtesy of the technology industry, which has fallen less than the benchmark in 2020.
In any case, market moves during this period have been exceptional, and it remains to be seen whether selling has been indiscriminate and performance trends will reverse.
Chart 2 – Performance in 2020.
Decisions in passive investing
This exercise works as a reminder of the importance of inspecting the methodology of an index in order to understand its strategy and how it is accomplished. Investors not only have the choice of a theme but also the optionality on how to achieve exposure to it.
1 USD, gross returns. All data as of Jan. 31, 2020.


