

Equities plummeted by the most since 2008 during March, as the global economy was forced into a standstill to combat the COVID-19 pandemic.
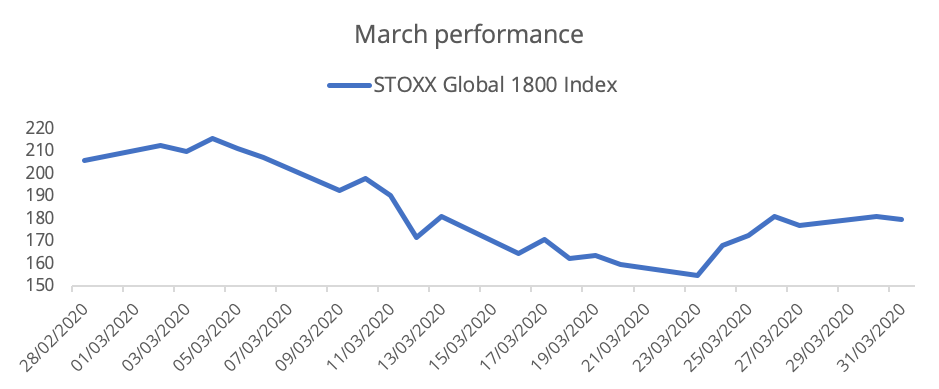
The STOXX® Global 1800 Index slumped 12.9% in dollar terms1 for the whole month, after a rebound in the final sessions helped pare a loss of as much as 24.8% (Chart 1). It was the second-worst month on record for the index, only topped by the 19% retreat in October 2008 at the depth of the global financial crisis.
Chart 1
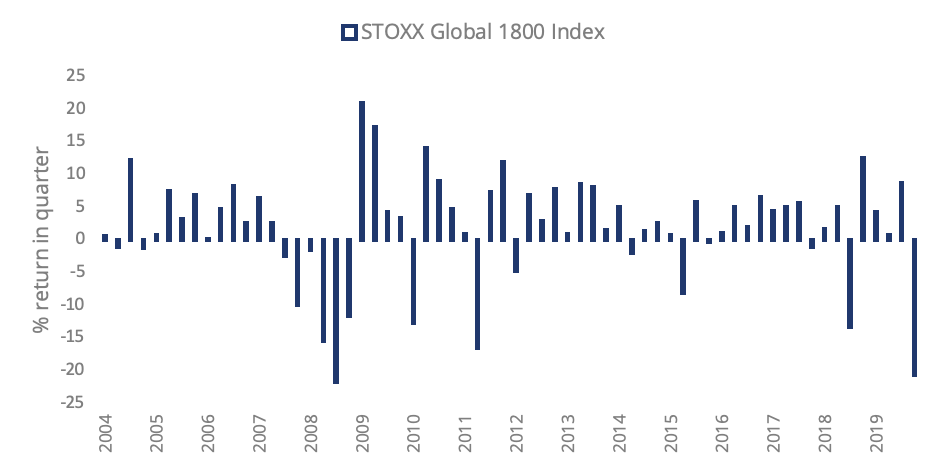
The index dropped 20.7% during the first three months of the year, its worst quarter since a 21.8% retreat in the fourth quarter of 2008 (Chart 2).
Chart 2
Historical losses across regions
All regional indices suffered in a similar way. The pan-European STOXX® Europe 600 Index tumbled 14.4% when measured in euros, its steepest monthly retreat on record, while the Eurozone’s EURO STOXX 50® Index lost 16.2%, the most since 2002. The STOXX® Asia/Pacific 600 Index decreased 11% in dollars and the STOXX® North America 600 Index lost 12.8%. It was the worst monthly performance since 2008 for the Asia and North America gauges.
Investors have priced in a global recession as governments worldwide shut down activity to contain the virus pandemic, and recent data all but confirm the expectations. Almost 3.3 million Americans filed for unemployment in the week ending Mar. 22, beating a previous 1982 record of 695,000 weekly claims. A week later, another 6.6 million Americans applied for jobless benefits.
In the Eurozone, a reading of business activity crumbled by the most ever in March to an all-time low, far exceeding the deterioration seen during the global financial crisis.2
Bear-market rally?
Traders had to contend with unprecedented volatility during the month, both on the downside as well as on the upside. March saw the three-worst declines for the STOXX Global 1800 since data begins in 2004, as well as two of the biggest daily returns ever recorded.
If investors were quick to dump equities, central banks and government were equally fast and determined in their monetary and fiscal policy reaction. As authorities across the world unveiled new stimulus to support economies, the STOXX Global 1800 jumped 17% between Mar. 24 and Mar. 26, its best three-day performance on record.
The Federal Reserve and the Bank of England were among central banks that slashed interest rates to record lows in the month that ended to counteract the economic disruption. On Mar. 27, the US Congress approved a 2-trillion-dollar relief program to bolster American consumers’ and companies’ financial standing. Many expect more financial help from governments in coming weeks.3
Affirmative intervention from authorities will only alleviate the disruption of closing businesses across the world. Deutsche Bank economists now estimate the US economy will contract 4.2% this year and the Eurozone’s will slow down by 6.9%.4
Readings of annualized volatility (measured as the standard deviation of daily index returns) spiked for all benchmarks and indeed across the entire STOXX range of indices. The volatility ratio for the STOXX North America 600 Index reached an all-time high in March.
The volatility ratio of the EURO STOXX 50 Index jumped to a near-record high, a move in line with the performance of the EURO STOXX 50® Volatility Index. The index known as VSTOXX® climbed to 85.6 on Mar. 16, its highest level since 1999 except only for one day in October 2008. The index tracks real-time options prices for the EURO STOXX 50 Index, thus reflecting market expectations of future – or implied – volatility in Eurozone stocks. Mar. 12 marked the steepest-ever daily jump for the volatility index.
Developed and emerging markets
All 25 developed markets and all 21 developing-nations indices tracked by STOXX fell during March. The STOXX® Emerging Markets 1500 Index dropped 19.8% in dollars. The STOXX® Developed Markets 2400 Index fell 13.6% in dollars and 13.5% in euro terms.
Oil stocks down, health care outperforms
Likewise, all 19 supersectors in the STOXX Global 1800 Index scored a loss for the month, led by the STOXX® Global 1800 Oil & Gas Index’s 28.8% slump. The price of US crude oil more than halved to $20 a barrel during March as Saudi Arabia held up production even as the global economy came to a halt.
The STOXX® Global 1800 Health Care Index fell 3.7%, the narrowest decline among all supersectors.
Minimum variance protects from some losses
Minimum variance strategies helped investors cushion market losses in Europe, although the strategy had mixed results elsewhere.
The STOXX® Europe 600 Minimum Variance Index topped its benchmark by 3.7 percentage points, while the unconstrained version did so by 2.9 percentage points. The STOXX® USA 900 Minimum Variance Index returned 2.9 percentage points more than the STOXX® USA 900 Index, but the unconstrained version of the Minimum Variance index performed in line with the benchmark. Still, all returns from the Minimum Variance indices came with lower volatility than benchmarks, enhancing the performance on a risk-adjusted basis.
The STOXX® Global 1800 Minimum Variance Index returned 0.7 percentage points more than the benchmark STOXX Global 1800 Index, while the STOXX® Global 1800 Minimum Variance Unconstrained Index outperformed by 1.3 percentage points.
Factor performance shows value slump
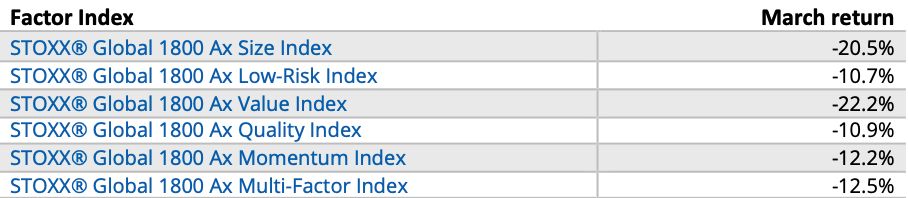
The STOXX Factor Indices, which seek to capture proven sources of equity risk and return, show investors dumped value stocks in March at almost twice the pace as they sold the broader market. The size factor, which targets the historical premium of the smallest companies, was also out of favor (Table 1).
Table 1 – STOXX Factor Indices
Premia, market-neutral indices
Value stocks were also avoided as measured by the EURO STOXX® Multi Premia® and Single Premium Indices, which are exposed to the market’s systematic risk.
The iSTOXX® Europe Factor Market Neutral Indices, which hold a short position in futures on the STOXX Europe 600 to help investors neutralize systematic risk, also struggled during March. All seven indices posted a loss during the month amid widespread selling. The iSTOXX® Europe Value Market Neutral Index fell almost 11%, the biggest monthly decline among all factor strategies since data begins in 2010.
ESG and sustainability
Among STOXX’s ESG and Sustainability indices, the EURO STOXX 50® ESG Index outperformed the EURO STOXX 50 by more than 2 percentage points. The ESG index incorporates negative exclusions and ESG scoring into stock selection.
Dividend strategies falter
Dividend strategies suffered some of the heaviest selling flows during the month, preceding a string of high-profile dividend cuts as companies face dwindling sales.
The STOXX® Global Maximum Dividend 40 Index, which selects the highest-dividend-yielding stocks, plummeted 20.1% in dollars on a net-return basis. The STOXX® Global Select Dividend 100 Index, which tracks companies with sizeable dividends but also applies a quality filter such as a history of stable payments, lost 20% on a gross-return basis. The STOXX® Global Select 100 EUR Index, which is measured in euros, had a similar loss. The index blends increasing dividend yields with low volatility.
For all three indices, March marked the worst monthly performance and highest volatility on record.
Featured indices
- STOXX® Global 1800 Index
- EURO STOXX 50® Index
- STOXX® Europe 600 Index
- STOXX® North America 600 Index
- STOXX® Asia/Pacific 600 Index
- STOXX® Developed Markets 2400 Index
- STOXX® Emerging Markets 1500 Index
- STOXX® Global 1800 Minimum Variance Index
- STOXX Factor Indices
- EURO STOXX® Multi Premia® and Single Premium Indices
- iSTOXX® Europe Factor Market Neutral Indices
- EURO STOXX 50® ESG Index
- STOXX® Global Maximum Dividend 40 Index
- STOXX® Global Select Dividend 100 Index
- STOXX® Global Select 100 EUR Index
1 All results are total returns before taxes.
2 IHS Markit Flash Eurozone PMI for March.
3 Wall Street Journal, ‘After Three Coronavirus Stimulus Packages, Congress Is Already Prepping Phase Four,’ Mar. 29, 2020.
4 Deutsche Bank Research, ‘Impact of Covid-19 on the global economy: Beyond the abyss,’ Mar. 30, 2020.


