

The recent market downturn and sharp increase in volatility were devastating to many investors’ portfolios. Even a traditional 60/40 portfolio of stocks and bonds suffered steep losses as many asset classes moved in the same direction — causing diversification benefits to evaporate. Bonds, stocks and even gold became much more positively correlated.1
The EURO STOXX 50® Index, which represents the largest 50 companies in terms of market capitalization across eight Eurozone countries, was hit particularly hard. The index plunged 38.2% from the market peak on Feb. 19 through Mar. 18 (Exhibit 1).
Exhibit 1 – Daily and cumulative net return in EURO STOXX 50 Index
Source: Qontigo, STOXX Index data. Net returns in euros.
Recent market moves suggest the heightened volatility may not be over. This begs the question: how can we protect our equity portfolios from future unexpected market routs? STOXX offers several indices designed to mitigate the impact of market drawdowns, without dramatically reducing the upside. In this blog post we focus on two such products.
EURO STOXX 50 Volatility-Balanced Index: allowing investors to benefit from market volatility
The first is the EURO STOXX 50® Volatility-Balanced Index (VBI). The index aims to provide superior risk-adjusted returns relative to the EURO STOXX 50 Index by coupling a base investment in the benchmark with a dynamic allocation to equity volatility (obtained via the VSTOXX Short-Term Futures Index). In this strategy, weights depend on the prevailing volatility regime. This regime is defined daily, based on 20-day realized volatility and 1-month implied volatility from a month ago, as reflected by the VSTOXX® Index.
Table 1 lays out the definitions of regimes and the associated exposures. While the frequency of potential rebalancings is high, there are only three potential regimes, meaning allocations will only change when there appears to be a significant change in the volatility climate.
Table 1 – Volatility regimes and associated exposures
| Daily Indicator | Volatility Regime | Equity Exposure | Volatility Exposure |
| RV < IV – 1% | Stable Volatility Regime | 97.5% | 2.5% |
| IV – 1% ≤ RV ≤ IV+ 1% | Unpredictable Volatility Regime | 90% | 10% |
| RV > IV + 1% | Increasing Volatility Regime | 70% | 30% |
The ability to benefit from investing in volatility would have presented a clear advantage in the recent downturn. Even though the EURO STOXX 50 Index fell substantially, the Volatility-Balanced Index returned 27.8 percentage points (pp) more than the benchmark from Feb. 20 to Mar. 18 (Exhibit 2).
Exhibit 2 – Euro STOXX 50 Volatility-Balanced Index performance
Source: Qontigo, STOXX index data.
To get a better long-term perspective, we examined the performance of the Volatility-Balanced Index under different market regimes. We split monthly returns data into four periods: the market downturn of 2008-2009; the bull market of 2009-2015; the market turmoil of 2015-2016; and the bull market of 2016-2020. Of course, one can always find an investment that zigged when others zagged. So, even more impressive is that over time the VBI has fared quite well, providing protection in higher-volatility down markets, while holding its own in at least one period of a sharply rising market.
Starting with the global financial crisis, the Volatility-Balanced Index outperformed the underlying index by 33.4pp from October 2007 through March 2009 (Exhibit 3). The VBI didn’t sacrifice much of the return, compared with the EURO STOXX 50, during the bull market from April 2009 through May 2015. As for the 2015-16 stock market turbulence, the VBI outperformed the index by 15.7pp.
Finally, the VBI trailed the underlying index by almost 34pp during the July 2016-February 2020 bull market — a substantial degree of underperformance in a strong market. However, as noted, when volatility spiked in March 2020 the allocation to equity volatility paid off, resulting in a 56.1-point outperformance from February through March 2020.
Exhibit 3 – Volatility-Balanced Index and EURO STOXX 50 Index returns under different regimes
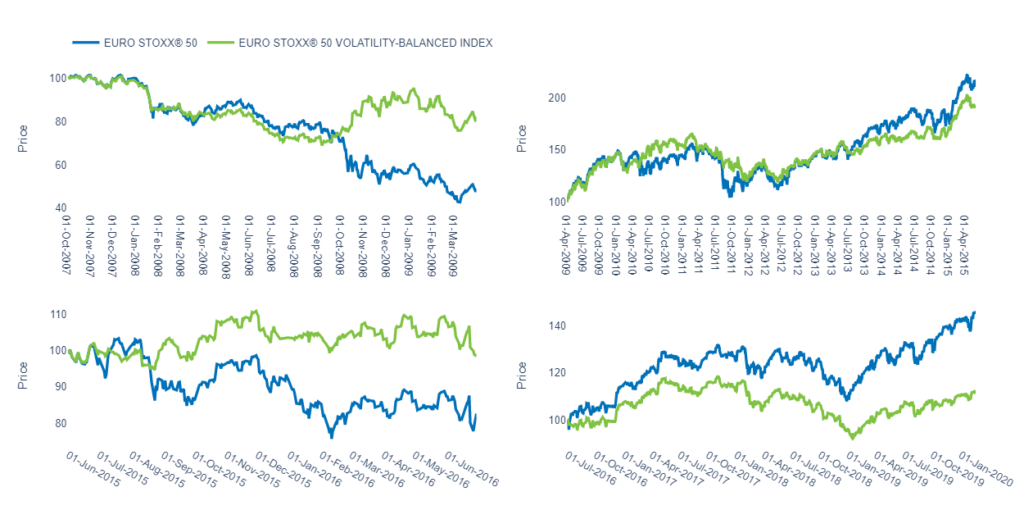
In Table 2 we summarize the performance. The Volatility-Balanced strategy’s success clearly favors bear-market periods, but while the bull-market period from July 2016 to February 2020 saw a significant and possibly disappointing level of performance for VBI, the prior bull market’s returns were not significantly lower for the strategy. The reversal after the market peak in February this year more than made up for that underperformance, however.
Table 2 – Cumulative returns of Volatility-Balanced Index by regime
| Market Regime | EURO STOXX 50 VOLATILITY-BALANCED | EURO STOXX 50 | Difference |
| Oct 2007-Mar 2009 | -17.64% | -51.08% | + 33.44% |
| Apr 2009-May 2015 | +90.51% | +110.24% | -19.73% |
| Jun 2015-Jun 2016 | -1.68% | -17.39% | +15.71% |
| Jul 2016-Feb 2020 | +12.23% | +46.14% | -33.91% |
| Feb 2020-Mar 2020 | +31.83% | -24.31% | +56.14% |
| Since Inception (Nov 2005) | +219.9% | +26.21% | +193.69% |
Of course, there is no guarantee that we would see the same degree of performance differential should the market continue to fall, or that these strategies will not underperform when the market eventually heads higher. However, knowing that there will be some protection to lessen the pain of a falling market may provide comfort to some investors spooked by the recent volatility.
EURO STOXX 50 Protective Put 80% Index: downside protection with upside participation
Another defensive strategy is buying protective puts. The EURO STOXX 50® Protective Put 80% 18m 6/3 Index aims to replicate a combined investment in the EURO STOXX 50 Index and a long position in a put option on the same index. The investment objective of the replicated strategy is to profit from the appreciation of the EURO STOXX 50 Index, while simultaneously limiting the losses in falling markets through the put option.
The put option is rolled quarterly in March, June, September and December. On each roll date, the existing option is sold and replaced by a new one with an 80% strike (i.e., it is 20% out–of–the–money). The options will always have three to six months until expiration, to avoid big price moves as the expiration date approaches. More details on the construction of the strategy can be found in the STOXX Strategy Index Guide.
Because this strategy does not benefit from a sharp increase in volatility like the Volatility-Balanced Index, the degree of its outperformance tends to be smaller. Although its return was negative, the EURO STOXX 50 Protective Put 80% Index outperformed the EURO STOXX 50 index by 11.50pp in the recent market rout (Exhibit 4).
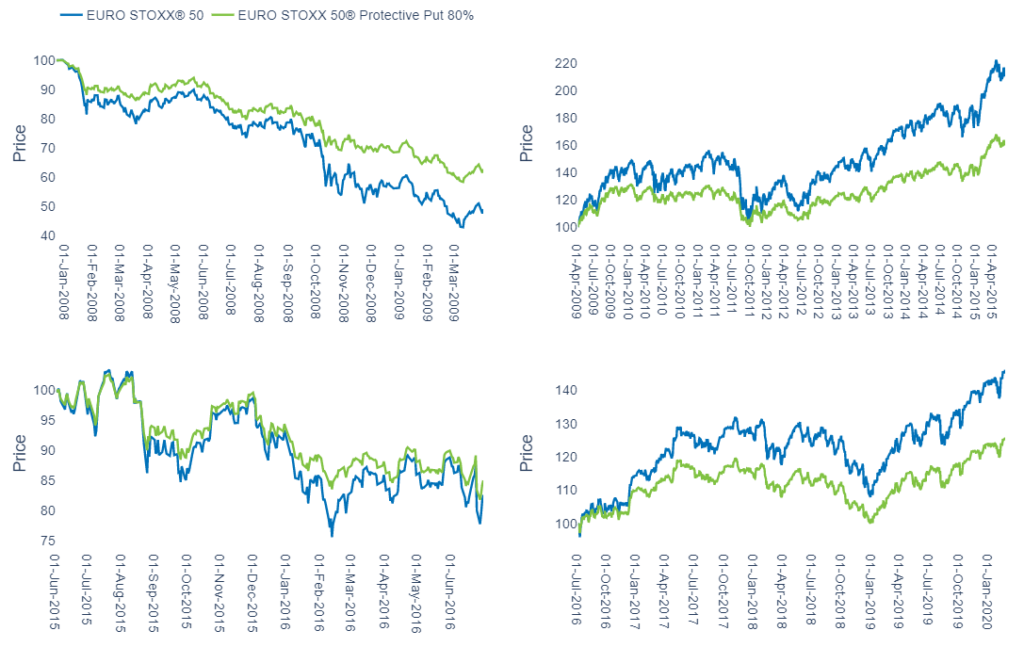
As expected, during the 2008 financial crisis, the EURO STOXX 50 Protective Put 80% Index outperformed the EURO STOXX 50 benchmark, as the investment in the put option offset some of the losses in the underlying index. The outperformance was 14pp, smaller than the edge achieved by the Volatility-Balanced Index.
During the bull market that followed the 2008 recession, the EURO STOXX 50 Protective Put 80% Index returned about half that of the underlying index. When market volatility picked up again in 2015-16, the EURO STOXX 50 Protective Put 80% Index outperformed the EURO STOXX 50 Index by 2.4pp, and then went on to underperform in the ensuing bull market by 20.4pp.
Exhibit 4 – EURO STOXX Protective Put 80% Index and EURO STOXX 50 Index returns under different regimes
Since its inception, the EURO STOXX Protective Put 80% Index has returned only slightly less than the EURO STOXX 50 Index — with the benchmark helped in no small part by the relatively high outperformance of the very recent period (Exhibit 5). Not a bad outcome for providing additional peace of mind when the market heads south.
Exhibit 5 – Cumulative returns for the period January 2008 – March 2020
Source: Qontigo, STOXX index data.
The performance of the EURO STOXX 50 Protective Put 80% Index during the different market regimes is shown in Table 3.
Table 3 – Cumulative returns of Protective Put 80% Index by regime
| Market Regime | EURO STOXX 50 Protective Put 80% | EURO STOXX 50 | Difference |
| Jan 2008-Mar 2009 | -37.37% | -51.09% | 13.72 |
| Apr 2009-May 2015 | 59.84% | 110.24% | -50.40% |
| Jun 2015-Jun 2016 | -14.98% | -17.39% | 2.41% |
| Jul 2016-Feb 2020 | 25.77% | 46.14% | -20.37% |
| Feb 2020-Mar 2020 | -13.22% | -24.31% | 11.09% |
| Since Inception (Jan 2008) | -10.02% | -9.23% | -0.79% |
We reviewed two strategies designed to mitigate the impact of market drawdowns. More broadly, STOXX manages a large family of indices that help portfolio managers invest in, and hedge against, volatility. Learn more about them in our paper entitled ‘Volatility – an Investable Asset Class.’
For more information on these and other defensive strategies, please speak with your Qontigo representative or see our website www.stoxx.com.
Featured indices
EURO STOXX 50® Volatility-Balanced Index
EURO STOXX 50® Protective Put 80% 18m 6/3 Index


