

The following article was originally published by Eurex.
By Russell Rhoads CFA, Head of Research and Consulting, EQDerivatives
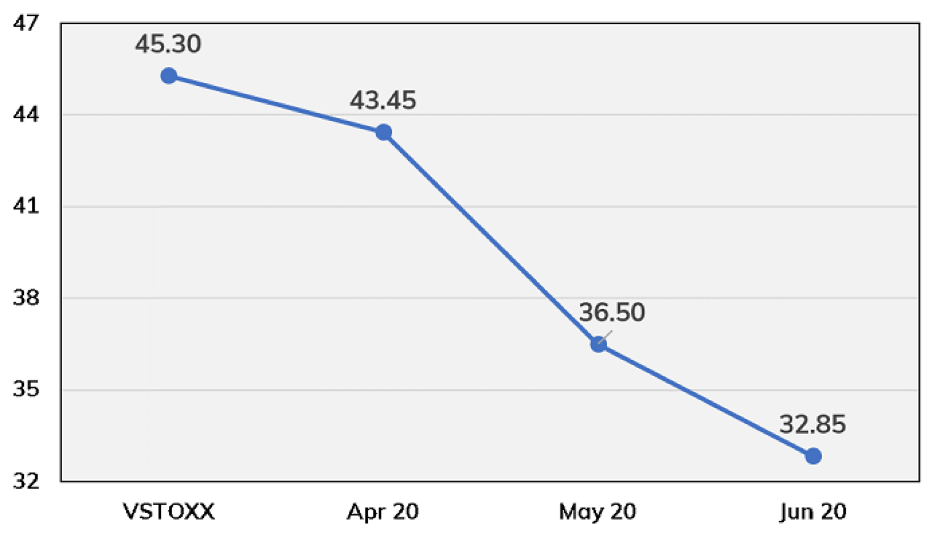
As of the market close on Apr. 14, the short end of the VSTOXX® Index futures’ term structure curve has been in backwardation every trading day since Feb. 24. Backwardation may be defined in many ways. In this case, backwardation is defined as comparing spot VSTOXX to the first three monthly VSTOXX futures contracts. As an example, the figure below shows this curve based on closing prices on Apr. 8.
Chart 1 – VSTOXX term structure on Apr. 8, 2020
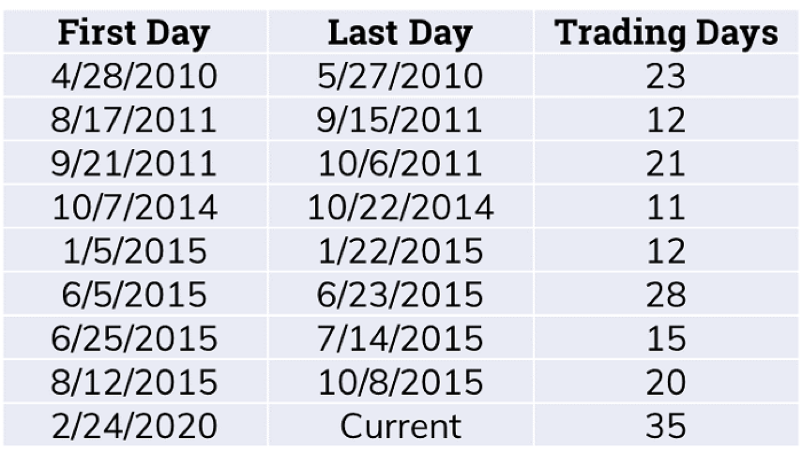
Extended periods of continuous backwardation are rare. Currently, VSTOXX and VSTOXX futures are in the ninth period since the launch of VSTOXX futures in 2009 of closing in backwardation for more than 10 days. This is also the longest period on record.
Table 1 – VSTOXX > Mo1 > Mo2 > Mo3 backwardation streaks
A popular strategy when the VSTOXX curve is in contango is to take a position that will benefit from VSTOXX futures’ pricing gravitating lower toward the spot index over time. Logically, during periods of backwardation, shorting VSTOXX futures is not a popular trading approach. So after experiencing an extended period of backwardation, when does it make sense to look to shorting VSTOXX futures?
A couple of historical tests show this trade makes sense shortly after the streak comes to an end.
The first run takes a look at selling the nearest month VSTOXX future that has at least fifteen days remaining until expiration and covering this contract fifteen days later. The table below shows the results behind blindly following this approach without any other considerations about the equity and volatility markets.
Table 2 – Short future first day of contango / cover fifteen days later
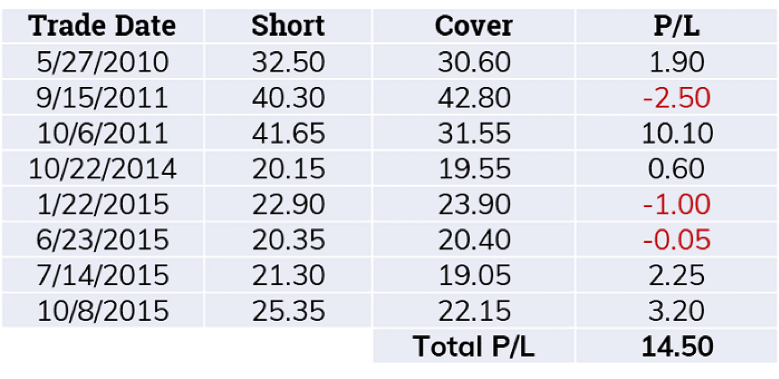
Five of the eight observations resulted in the future price closing at a lower level than where it was the day after the end of the backwardation streak. The three occurrences where the future was higher were not terribly significant, with the biggest ‘loss’ at 2.50 in September 2011. The sum of paper-traded shorts is 14.50 across all eight observations, with a large portion of the gains coming in October 2011. These initial results are encouraging and led to a bit more testing.
A second run shifts from just shorting a near-dated VSTOXX contract to putting on a calendar spread with the near-dated contract being sold and the next expiring VSTOXX future being purchased. As in the first run, a trade would be placed on the close of the first day after the end of a backwardation streak of over ten days and exited fifteen days later. The table below shows the results from this test.
Table 3 – Short front month / buy second month, exit fifteen days later
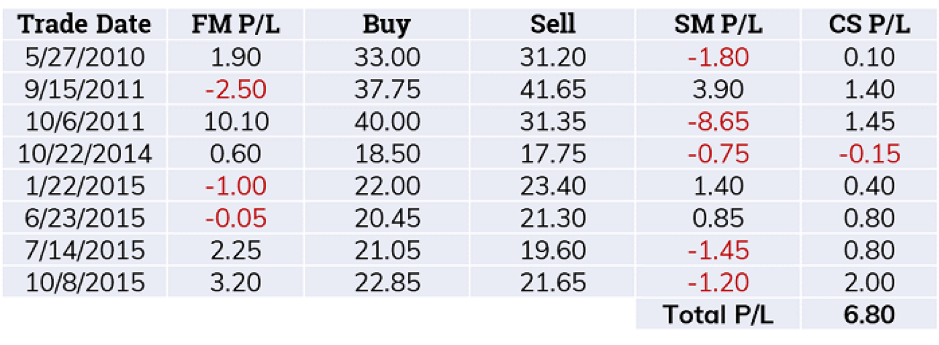
The table incorporates the results from the first test under the column FM P/L with the balance of the columns showing the entry and exit price for the long contract in the calendar spread along with profit or loss of this leg of the spread (SM P/L) and the profit or loss of the calendar spread (CS P/L).
Seven of the eight observations resulted in a profit with the total result summing to a profit of 6.80. Although the net profit is lower using calendar spreads versus just shorting the near-dated contract, the variability of results is much smoother with this approach. Also, remember these observations come on the heels of a market environment that likely was not favorable for sellers of volatility, so traders may use a more cautious approach to shorting volatility than in a normal market environment.
Historically, shorting VSTOXX futures works best when held to just before expiration. The future gravitates toward the index level with most of the price difference between the two being closed as expiration approaches. Keeping this aspect of selling VSTOXX futures in mind, a second run at shorting volatility futures after the end of a protracted period of backwardation and not exiting the trade until the day before expiration was tested. The results reflected the outcome of testing with a fifteen-day exit rule
The next table shows the results for selling the nearest-dated future with at least fifteen days remaining until expiration and exiting the day before expiration.
Table 4 – Short future first day of contango / cover day before expiration
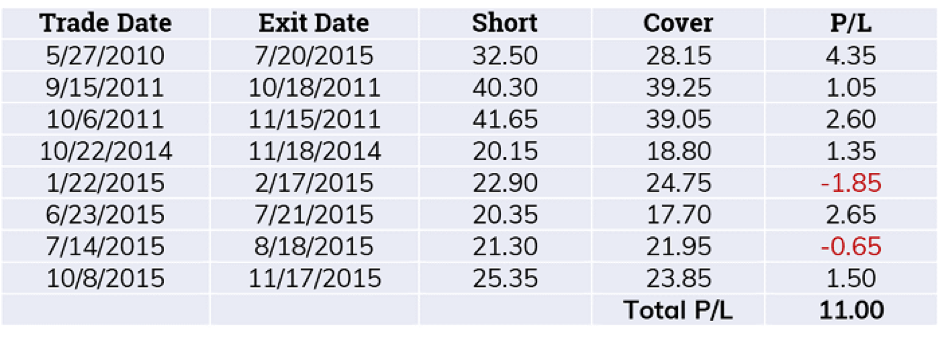
Six of eight observations resulted in the VSTOXX future price lower than where it was the first day after a backwardation streak. The two observations where the contract was not lower were not dramatically higher than the closing price the day after the streak ended. The total profit is a little lower than with the fifteen-day exit, but the results are spread out a bit more with no single observation accounting for a big portion of the overall profits.
Finally, a calendar spread initiated after the end of the backwardation streak and exited the day before the near-month contract expires was tested. These results appear below.
Table 5 – Short front month / buy second month, exit day before front-month expiration
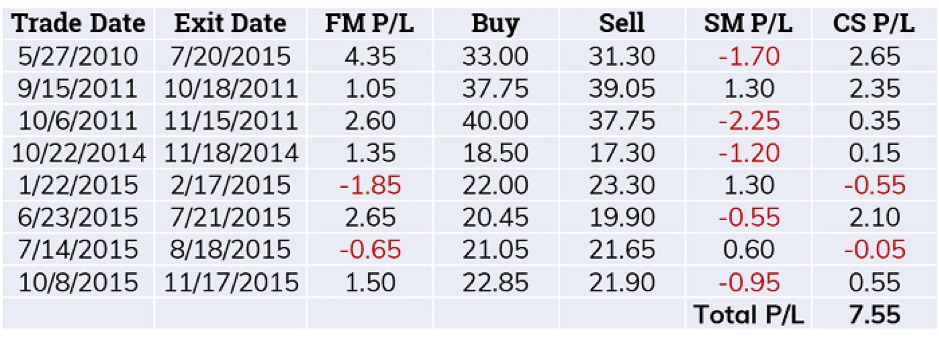
The total profit for this approach is slightly higher than the test using a fifteen-day exit. The two losses are minimal with this approach and this look at selling the near-month and buying the next-month VSTOXX future has a more equitable distribution of results versus the fifteen-day exit strategy.
Once the VSTOXX term structure returns to contango, traders may be hesitant to return to the VSTOXX futures market with the recent memory of market volatility weighing on their decision-making process. However, looking at history, once the backwardation streaks have come to an end, the environment is favorable for shorting volatility either through selling a VSTOXX future or, if a more cautious approach is desired, putting on a calendar spread.


