
Stocks jumped the most in 11 years during April as monetary and fiscal stimulus prompted investors to snap up shares trading at multi-year lows amid the COVID-19 pandemic.
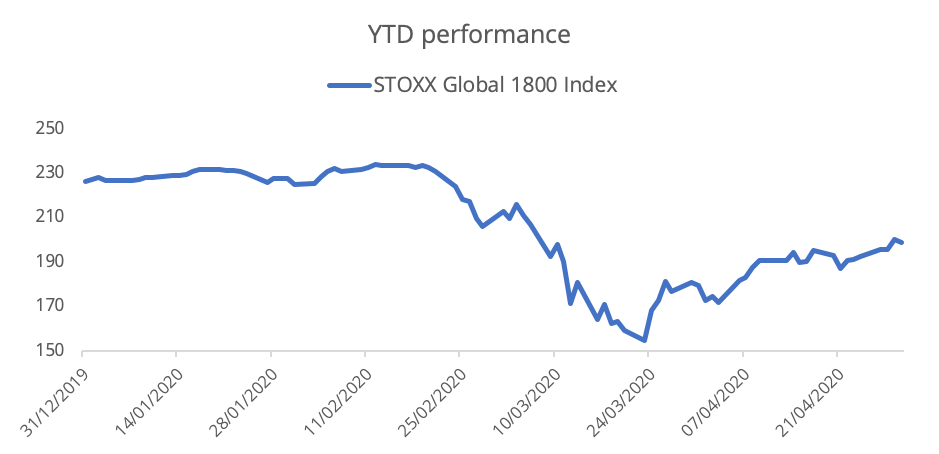
The STOXX® Global 1800 Index surged 10.8% in dollar terms1 for the whole month, following a 12.9% drop in March that dragged the index to its lowest level since 2016. April marked the index’s strongest monthly performance since April 2009, when equities rebounded from the global financial crisis, and its second-steepest monthly gain on record. The index is now down 12.2% for 2020.
Chart 1
The STOXX® North America 600 Index posted its best monthly showing since data begins in 2004, climbing 13%, leading gains among the three major regions. The pan-European STOXX® Europe 600 Index jumped 6.6% when measured in euros, while the Eurozone’s EURO STOXX 50® Index added 5.4%. The STOXX® Asia/Pacific 600 Index increased 7.3% in dollars.
Investors were encouraged back into equity markets as central banks and governments around the world acted to support a global economy that has been virtually in standstill for weeks to combat the coronavirus spread. Gains in stocks came even as many countries reported their worst first-quarter economic figures in decades.
In spite of the strong returns, volatility measures across the board remained significantly higher than the average for each respective index. The EURO STOXX 50® Volatility Index, or VSTOXX® Index, a measure of Eurozone equity volatility, ended April at 34. That’s lower than the 49 reading on Mar. 31 but higher than the long-term average of 24.
Developed and emerging markets climb
All 25 developed markets and all 21 developing-nations indices tracked by STOXX climbed during April. The STOXX® Emerging Markets 1500 Index advanced 10.6% in dollars. The STOXX® Developed Markets 2400 Index rose 11% in dollars and 11.2% in euro terms.
Basic-resources stocks lead gains
Likewise, all 19 supersectors in the STOXX Global 1800 Index advanced during the month, led by the STOXX® Global 1800 Basic Resources Index’s 18.1% gain. The index is still the worst-performing sector for the past six months.
The STOXX® Global 1800 Oil & Gas Index came out third with a 15.9% advance even as US oil prices fell into negative territory for the first time in history. The index tumbled 28.7% in March.
The STOXX® Global 1800 Utilities Index came out at the bottom of the Supersectors ranking during April, adding 3.2%.
Dividend strategies continue to underperform
Dividend strategies underperformed for a fourth consecutive month amid a string of high-profile dividend cuts from companies facing dwindling sales.
The STOXX® Global Maximum Dividend 40 Index, which selects the highest-dividend-yielding stocks, rose 6.8% in dollars on a net-return basis. The STOXX® Global Select Dividend 100 Index, which tracks companies with sizeable dividends but also applies a quality filter such as a history of stable payments, gained 5.9% on a gross-return basis. The STOXX® Global Select 100 EUR Index, which is measured in euros, climbed 6.1%. The index blends increasing dividend yields with low volatility. All three indices had lost 20% in March.
Despite the gains, all three gauges posted in April their second-highest monthly volatility reading on record.
Minimum variance lags behind
Also lagging benchmarks amid the strong rebound in risk appetite were minimum variance strategies.
The STOXX® Global 1800 Minimum Variance Index returned 3.1 percentage points less than the benchmark STOXX Global 1800 Index, while the STOXX® Global 1800 Minimum Variance Unconstrained Index lagged by 6.6 percentage points. Similar underperformances were registered in Europe and the US as investors favored higher-volatility shares.
The STOXX® Minimum Variance Indices come in two versions. A constrained version has a similar exposure to its market-capitalization-weighted benchmark but with lower risk. The unconstrained version, on the other hand, has more freedom to fulfill its minimum variance mandate within the same universe of stocks.
Momentum is best factor
The STOXX Factor Indices, which seek to capture proven sources of equity risk and return, show investors favored momentum stocks during April. The STOXX® Global 1800 Ax Momentum Index rose 15%. The STOXX® Global 1800 Ax Size Index, which targets the historical premium of the smallest companies, and the STOXX® Global 1800 Ax Quality Index, which selects stocks with the highest profitability ratios, rose 12.2% and 12%, respectively.
On a regional basis, the STOXX® USA 900 Ax Momentum Index and STOXX® Asia/Pacific 600 Ax Momentum Index also garnered the strongest investor interest in each respective region.
All iSTOXX® Europe Factor Market Neutral Indices, which hold a short position in futures on the STOXX Europe 600 to help investors neutralize systematic risk, had positive returns during April.
The iSTOXX® Europe Size Market Neutral Index was the stand-out performer after adding 4.6% on a net-return basis during the month.
The EURO STOXX® Multi Premia® and Single Premium Indices, which are exposed to the market’s systematic risk, also recorded gains across all factors in the month that ended, with almost all of them outperforming the EURO STOXX® Index benchmark. Again, size was the best-performing factor in the region, according to this index family.
ESG and sustainability
STOXX’s ESG and Sustainability indices posted returns that weren’t far off from those of their respective benchmarks. That included the EURO STOXX 50® ESG Index, which is derived from the EURO STOXX 50 Index and incorporates negative exclusions and ESG scoring into stock selection.
The ESG index has outperformed its benchmark by nearly 3 percentage points in 2020.
The STOXX ESG-X Indices also performed broadly in line with their benchmarks during April, allowing investors to track the respective markets’ moves while complying with sustainable policies.
The DAX® 50 ESG Index, which excludes companies involved in controversial activities and integrates environmental, social and governance (ESG) scoring into stock selection, rose 10.7%, beating the 9.3% advance in the flagship DAX®.
Featured indices
STOXX® Global 1800 Index
EURO STOXX 50® Index
STOXX® Europe 600 Index
STOXX® North America 600 Index
STOXX® Asia/Pacific 600 Index
STOXX® Developed Markets 2400 Index
STOXX® Emerging Markets 1500 Index
STOXX® Global 1800 Minimum Variance Index
STOXX Factor Indices
EURO STOXX® Multi Premia® and Single Premium Indices
iSTOXX® Europe Factor Market Neutral Indices
EURO STOXX 50® ESG Index
STOXX® Global Maximum Dividend 40 Index
STOXX® Global Select Dividend 100 Index
STOXX® Global Select 100 EUR Index
DAX® 50 ESG Index
1 All results are total returns before taxes.


