

The EURO STOXX 50® Volatility-Balanced Index is posting its best year on record, proving the prowess of a tail-risk hedge strategy as the COVID-19 pandemic brought economies to a standstill and rattled financial markets.
The index combines a base investment in the benchmark EURO STOXX 50® Index with a variable allocation to equity volatility by means of the EURO STOXX 50® Volatility (VSTOXX®) Short-Term Futures Index. The strategy dynamically allocates weight away from equities into volatility futures in times of market stress, with each asset’s weight determined by the prevailing volatility environment.
The EURO STOXX 50 Volatility-Balanced Index seeks to exploit the historically negative correlation between equity volatility and the underlying market, allowing the hypothetical portfolio to profit from market uptrends while providing insurance during volatile periods. As such, the index attempts to diversify risk across the business cycle.
Figure 1 shows the performance of the EURO STOXX 50 Volatility-Balanced index in the past five years. Buying protection against sharp market swings has been a particularly profitable strategy this year.
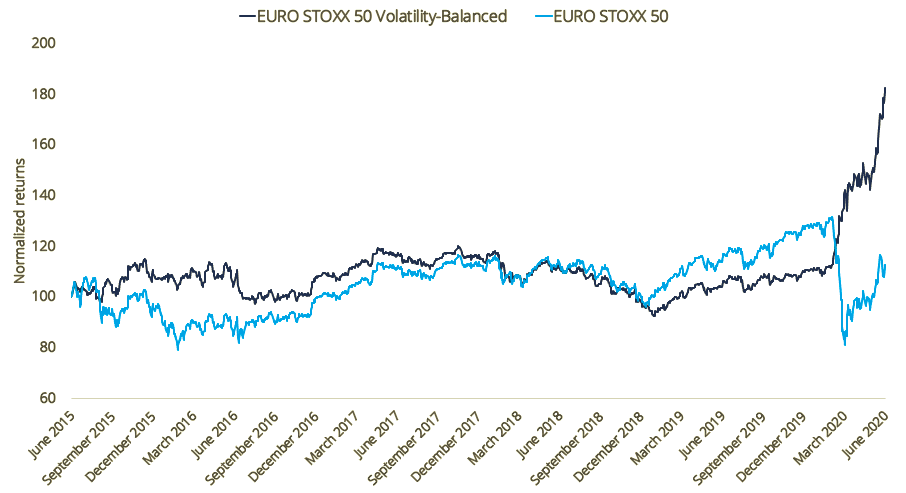
Source: STOXX index data, gross returns in euros, normalized at 100 on Jun. 17, 2015
The EURO STOXX 50 Volatility-Balanced Index has risen 64.6% in 2020, even as the benchmark is down 10.3%. Such outperformance for the volatility hedging strategy would be the widest for any calendar year since data going back to 2006 (Figure 2).
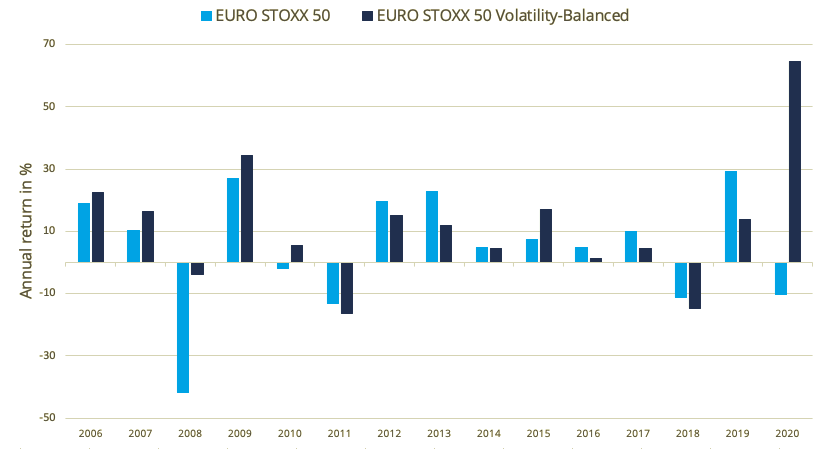
Source: STOXX index data, gross returns in euros. Backtested data through Jun. 23, 2020
On average, the EURO STOXX 50 Volatility-Balanced Index has climbed 11.8% every year since 2006, compared with an average gain of 5.1% for the benchmark EURO STOXX 50. While the Volatility-Balanced index has provided protection during worst-case market scenarios, it has also posted positive returns in every year of broader market gains.
The absolute returns look even better when adjusted for the investment strategy’s risk. The EURO STOXX 50 Volatility-Balanced Index’s annualized volatility for the past five years is 14.6%, compared with 20.5% for its benchmark.
A systematic allocation model
Investing in protection against volatility can represent a significant drag on returns during stable or bull markets. As such, replacing a fixed allocation to the hedge with a systematic and flexible allocation can make a crucial difference in terms of overall results.
At the heart of the Volatility-Balanced index’s methodology and allocation model is a prevailing volatility environment indicator. This gauge compares the Eurozone market’s one-month actual, or realized, volatility (RV) against its one-month implied volatility (IV), in order to capture anticipated changes in the volatility environment.
When RV exceeds IV, the index switches from a ‘stable volatility regime’ to an ‘increasing volatility regime,’ triggering a higher volatility exposure. A middle-ground scenario where RV may be moving above IV, or is close to, is reflected in a third position of an ‘unpredictable volatility regime.’ Table 1 shows the investment exposure for each one of those three scenarios.1
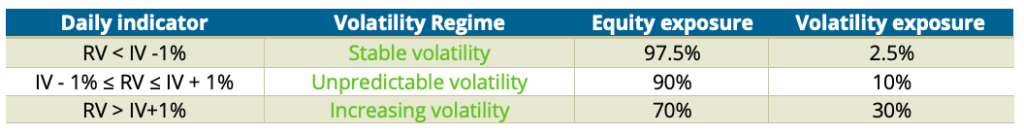
Source: Qontigo. To read about the change triggers in the volatility regime, visit the STOXX Strategy Index Guide, chapter 10
Timing of volatility regimes
For example, the EURO STOXX 50 Volatility-Balanced Index moved to an ‘increasing volatility regime’ from Feb. 4 to Apr. 8 this year, lifting the allocation to VSTOXX futures to 30%. During that period, the underlying EURO STOXX 50 slumped 22% while the EURO STOXX 50 Volatility-Balanced Index rose 33% (VSTOXX futures quadrupled in value during that period).
From Apr. 9 to Jun. 5, the EURO STOXX 50 Volatility-Balanced Index returned to a stable volatility regime, allowing near-full exposure to equities as the market rallied 15.6%. Since then, the index has been in an increasing volatility regime for most days.
The effect of large drawdowns
As mentioned earlier, the volatility hedge weighs on returns during rising markets. Yet a key element of the strategy is that it attempts to bypass the types of drawdowns experienced this year that can leave a long-lasting dampening effect on returns. In other words, avoiding the deep losses more than offsets missing out on the big gains.
Figure 3 shows, in backtested data, how the volatility-balanced strategy skirted a significant part of the global financial crisis’ fallout. As markets lost more than a quarter of their value at the end of 2008, extending earlier losses in the year, the volatility hedge strategy rebounded and logged a fourth-quarter advance of 27% (orange circle in figure). Even as markets rallied in the ensuing quarters, the benchmark hasn’t managed to revert the underperformance originated during that episode.
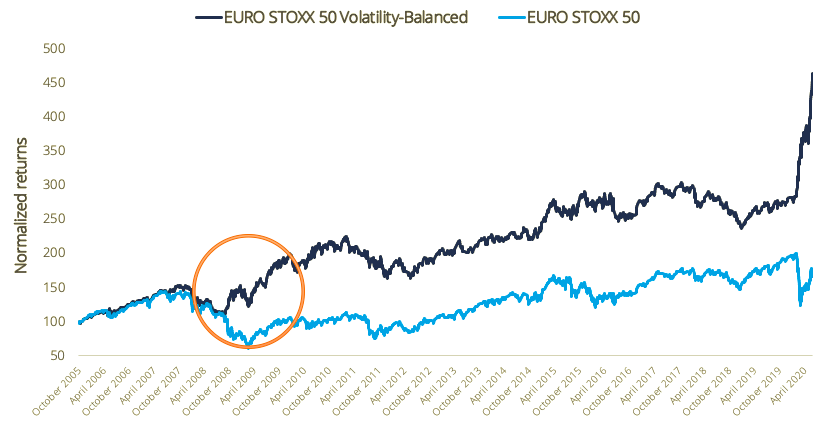
Source: STOXX index data, gross returns in euros, Oct. 18, 2005 – Jun. 17, 2020. Performance of Volatility-Balanced index is backtested
A range of volatility indices
The EURO STOXX 50 Volatility-Balanced Index is part of a wider menu of Qontigo volatility-focused solutions. The most-widely tracked indices in this suite are the EURO STOXX 50 Volatility (VSTOXX) Indices, which measure implied volatilities of EURO STOXX 50 Index options across their entire expiration curve and are considered the gauge for European equity volatility. Eurex-listed futures and options on the indices offer an accurate and cost-effective way to take a directional view on European volatility.
Similarly, the VDAX-New® Index tracks options prices on Germany’s DAX®.
These indices offer exposure to pure volatility – i.e. the portfolio does not react to price fluctuations but only to changes in volatility. The EURO STOXX 50® Volatility of Volatility Index (V-VSTOXX) measures the implied volatility of options on VSTOXX futures, hence reflecting expectations regarding the volatility of volatility.
Volatility strategy indices
Qontigo’s volatility strategy indices also include the EURO STOXX 50® Investable Volatility Index, which measures forward implied volatility in the Eurozone equity market, the VSTOXX® Mid-Term Futures Indices, VSTOXX® Short-Term Futures Investable Index and VSTOXX® Short-Term Futures Inverse Investable Index.
The family is completed by the Dynamic VSTOXX® Index, which combines the VSTOXX Short-Term Futures Index and the VSTOXX Mid-Term Futures Index to exploit the superior performance of short-term futures when the volatility forward curve is in backwardation and of mid-term futures when the volatility forward curve is in contango.
For a detailed look into all the strategies, please visit a research study from last year here.
More tools for investors
A difficult 2020 is a reminder that volatility can be a determining factor in long-term performance and returns. With innovative ways to manage volatility through straight-forward and transparent methodologies and products, investors can protect portfolios against losses and, indeed, even take advantage of market stress.
Featured indices
EURO STOXX 50® Volatility-Balanced Index
1 In addition, a stop-loss criterion is applied: if the weekly performance of the EURO STOXX 50 Volatility-Balanced Excess Return Index shows a loss of 5% or more, both equity and volatility allocations are moved completely into a cash position.


