

Specific stock selection was the main driver behind the outperformance of sustainable investment strategies during the COVID-19 pandemic, as the portfolios had limited exposure to hard-hit sectors such as aerospace & defense and tobacco.
Such is the conclusion of a new Qontigo study1 that looked into returns of two STOXX® ESG-X Indices, which incorporate negative screens on flagship benchmarks. The norm- and product-focused exclusions are based on standard policies of leading asset owners and remove companies that are non-compliant with Sustainalytics’ Global Standards Screening,2 or are involved in controversial weapons, tobacco production or thermal coal.3
Exhibit 1, taken from the report, shows the cumulative impact of exclusions on total returns relative to the benchmark (BM) STOXX® Europe 600 Index. Exclusions relating to controversial weapons, tobacco, and thermal coal contributed to incremental returns over the benchmark, when looked at each one in isolation, whereas removals relating to global standards detracted from returns over the period.
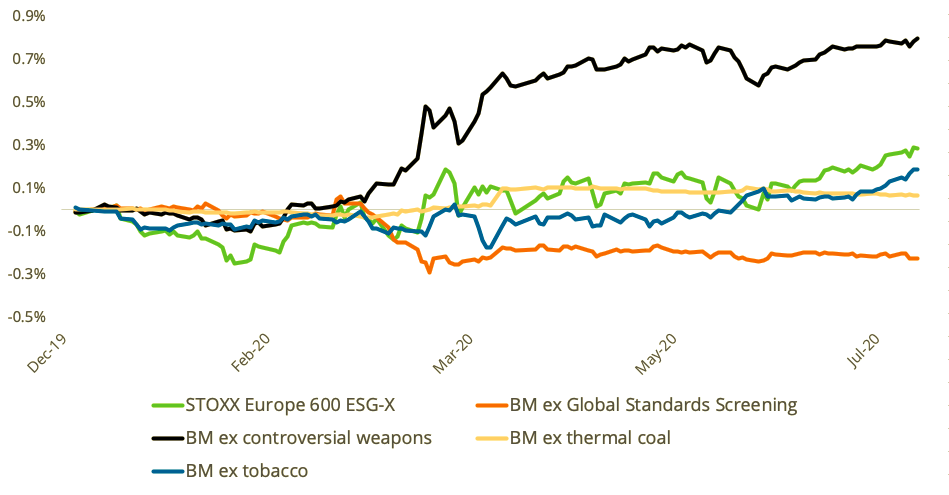
Source: Venkataraman, A., Williams, L., ‘STOXX® ESG-X Indices Outperform During Market Distress’. Gross returns in euros, Dec. 20, 2019 – Jul. 17, 2020.
Overall, the STOXX® Europe 600 ESG-X Index returned 0.29 percentage points more than the benchmark over the period considered (Exhibit 2). Interestingly, the ESG-X Index also delivered lower annualized volatility than the benchmark.
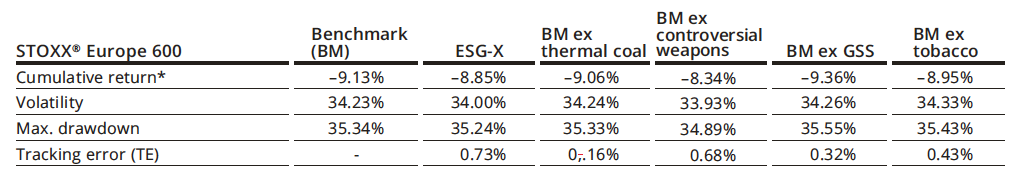
Source: Venkataraman, A., Williams, L., ‘STOXX® ESG-X Indices Outperform During Market Distress’. Gross returns in euros, Dec. 20, 2019 – Jul. 17, 2020.
Factor attribution
A factor-based performance attribution reveals that this active return was driven by moves that are specific to selected stocks and can be explained by the stocks’ individual characteristics — and was offset to a large extent by style factor exposures. Although most of the latter were small, the benchmark’s slump over the period led to a drag from the market sensitivity factor in particular, the study’s authors say (Exhibit 3).
“Further analysis reveals that many of the exclusions belonged to sectors that were badly affected by the COVID-19 pandemic and the resulting market distress, such as aerospace & defense,” write Anand Venkataraman and Ladi Williams, of Qontigo’s Index Product Management team, in the report. “Other exclusions were primarily from sectors such as tobacco, automobiles, oil, gas and consumable fuels. The incidental underperformance of these securities in the benchmark resulted in the outperformance of the ESG-X Index.”
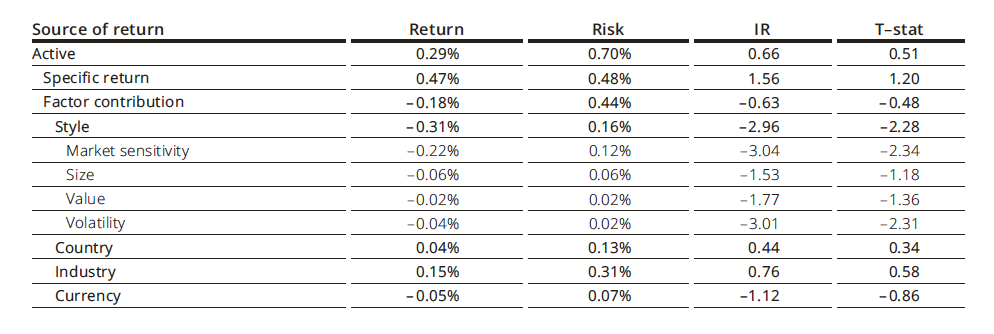
Source: Venkataraman, A., Williams, L., ‘STOXX® ESG-X Indices Outperform During Market Distress’. Axioma Portfolio Analytics, index is STOXX Europe 600 ESG-X Index, gross returns in euros, Dec. 20, 2019 – Jul. 17, 2020. Only a subset of Style sub-factors is shown.
US exclusions yield larger outperformance
A similar analysis on the STOXX® USA 500 ESG-X Index reveals an even larger outperformance of an ESG-exclusions portfolio to the benchmark. In the same period as considered above, the ESG-X index returned 4.91% while the benchmark STOXX® USA 500 Index gained 3.15%, with all exclusions adding to benchmark returns.4
In the US case, however, a factor-based performance attribution analysis shows that the active return was in part the result of ESG-related specific exclusions and of factor contributions. Among the latter, the industry factor was the predominant driver of returns.
Both the STOXX Europe 600 ESG-X Index and the STOXX USA 500 ESG-X Index underlie derivatives listed on Eurex.
Long-term returns
The STOXX ESG-X indices are designed to systematically avoid extreme risk exposures and hence may outperform during the short term. Over the long term, as concluded in earlier studies, the indices deliver a risk-return performance profile that does not differ significantly from their respective benchmarks.
We invite you to read the entire the report here.
Featured indices
STOXX® Europe 600 ESG-X Index
STOXX® USA 500 ESG-X Index
1 Venkataraman, A., Williams, L., ‘STOXX® ESG-X Indices Outperform During Market Distress’ Qontigo, July 2020.
2 Global Standards Screening identifies companies that violate or are at risk of violating commonly accepted international norms and standards, enshrined in the United Nations Global Compact (UNGC) Principles, the Organisation for Economic Co-operation and Development (OECD) Guidelines for Multinational Enterprises, the UN Guiding Principles on Business and Human Rights (UNGPs), and their underlying conventions.
3 Companies that generate at least 25% of revenue from thermal coal mining and exploration and those that have at least 25% thermal coal-based power generation capacity are excluded.
4 Gross returns in dollars, Dec. 20, 2019 – Jul. 17, 2020.


