

If the theme of the first quarter (Q1) was the COVID 19-induced shock, then the second quarter’s (Q2) theme was disjointedness. As equity markets turned in a historically positive performance, the V-shaped equity performance in 2020 masked the ongoing impacts to the real economy.
In the factor world, Q2 saw a continuation of some themes from the start of the year — with gains in Quality and Momentum accelerating. On the other hand, we saw certain steep course reversals, namely with Low Risk falling well behind in the market rally. In Figure 1, we show Q1 and Q2 returns for the STOXX® Factor Indices in excess of respective benchmarks. In Figure 2 we include the performance of the newly launched STOXX® ESG-X Factor Indices, which enable the continued convergence of factor and sustainable investing. These show a similar picture to the standard factor indices.
Figures 1 and 2
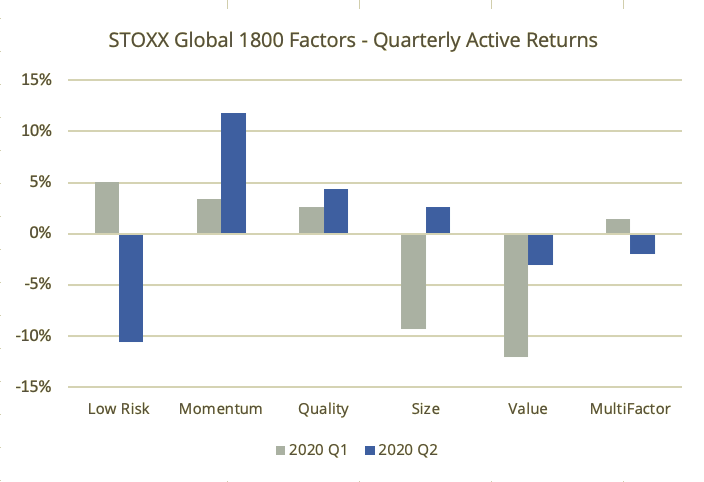
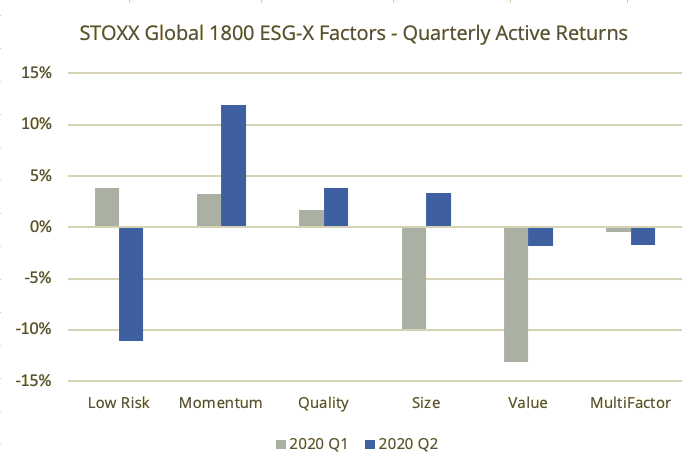
Source: Qontigo. Data prior to index launch simulated. USD Gross Returns. Benchmarks are the STOXX® Global 1800 Index and its ESG-X version.
It is likely worth noting that the recent quarterly active returns in the area of +/-10% are much larger than one would expect during less turbulent times. The (so far) V-shaped market returns have led to significantly larger active returns and active risk than are usually reported.
In this note, we spotlight a few portfolio construction aspects of the STOXX factor index suite, and how they fared recently. We start with the ESG-X family.
Spotlight – ESG-X factor exposures
A key focus of the ESG-X factor indices, as highlighted in our recent blog post, is the goal of achieving similar factor exposures to our flagship, or standard-factor, versions over time. A combination of negative screening and an outcome-oriented approach (i.e. optimization) allows the indices to meet the multiple objectives of a sustainable set of components, high-targeted factor exposures, limited unintended exposures and a liquid portfolio.
To illustrate this, we take a closer look at the Quality factor — a current focus of many investors, and a factor often cited as having a relationship to ESG. Focusing on the differences in factor exposures between the Factor indices and their ESG-X versions, we compile average active exposures (relative to the STOXX Global 1800 benchmark) over time, and group 12 style factors from the Axioma Risk Model into either ‘targeted’ or ‘non-targeted.’
Figures 3 and 4
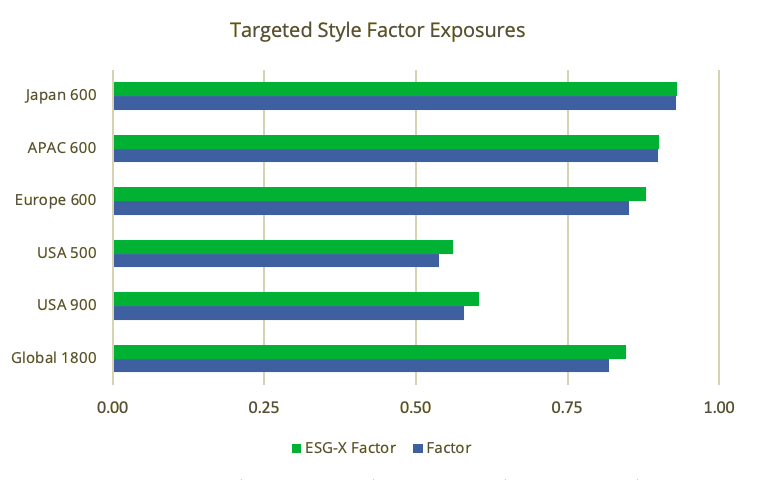

Source: Qontigo. Mar. 12 – Mar. 20. Data prior to index launch simulated. Active exposures (standard deviations) shown are based on average absolute daily exposures, using respective regional Axioma Risk Models and STOXX benchmarks.
As can be seen, while the targeted factor exposures in Figure 3 (in this case, the combination of high Profitability and low Leverage) vary across regions, the Factor and ESG-X factor exposures are similar within regions. In Europe and the U.S., the exposure to Quality actually increases slightly using the ESG-screened universes. The non-targeted factor exposures (Figure 4) are both universally much lower, and nearly identical for the Factor and ESG-X Factor indices. This is partly by design, as non-targeted style factors are constrained to within 0.25 standard deviations of their respective benchmark exposures.
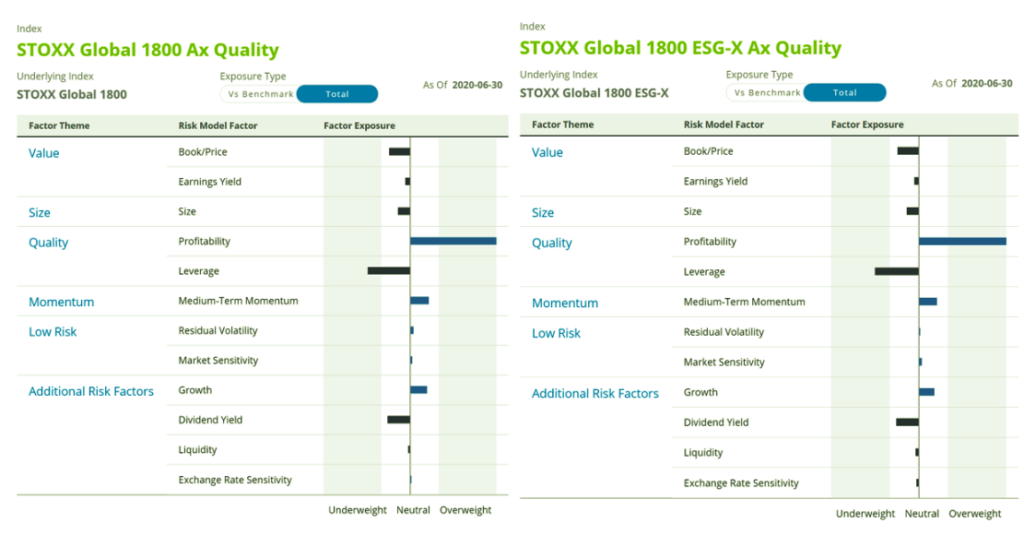
Using Qontigo Factor iQ™ for a more granular view, we can visualize in Figure 5 the individual style factor exposures in both Quality indices, and can observe the similarities as of Jun. 30 this year, following their quarterly rebalance earlier in the month. Both indices exhibit strong positive profitability exposures and corresponding strong negative leverage scores, as is consistent with our Quality definition.
Figure 5
Spotlight – Mixing vs. Integrated in 2020
A popular topic of discussion in the factor world remains the construction of multi-factor indices, and within it, that of the integrated/bottom-up approach vs. the mixing/top-down approach. The STOXX Multi-Factor index is built using the first of those two approaches, meaning securities are selected based on their strength of exposure across multiple target factors, as opposed to an index constructed via a combination of individual single factor indices.
The integrated method was chosen to fit the goals of strong intended factor exposures, while recognizing that there are also advantages to the mixed approach, such as simplicity of construction and attribution. This is also detailed in a recent blog post from my colleague Melissa Brown.
While trade-offs exist for this construction paradigm, outcomes can differ meaningfully. The charts below illustrate how the two strategies have fared so far in 2020, along with their respective attributions.
Figures 6 and 7
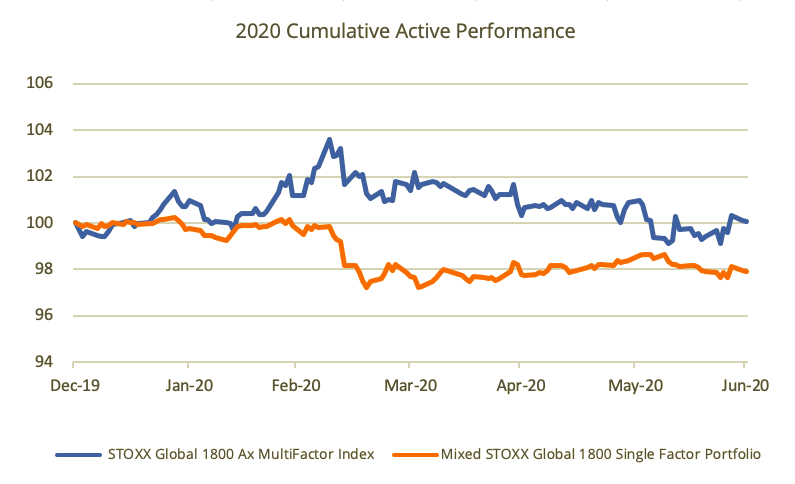
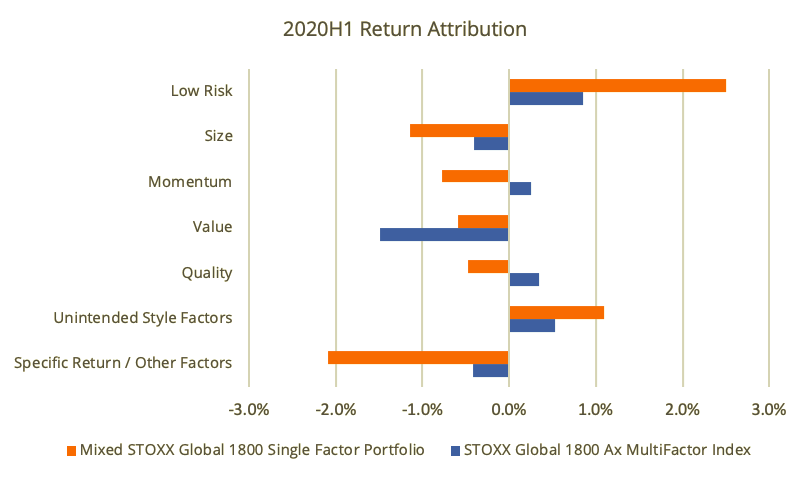
Source: Qontigo. Dec. 31, 2019 – Jun. 30, 2020. Data prior to index launch simulated. Mixed portfolio performance is constructed for illustrative purposes using average daily returns. Attribution based on Axioma WWMH4 Risk Model and STOXX Global 1800 benchmark, daily sampling.
For the first half of 2020, the illustrative Mixed portfolio has underperformed the benchmark, while the Integrated approach has fared only slightly better, with a poorer Q2. Looking at the attribution for this period, we observe that the Mixed portfolio was able to better capitalize overall on the Low Risk factor (as defined by Market Sensitivity and Residual Volatility in the Axioma Risk Model), and Value and Size exposures acted as a drag on both methods. However, the accumulated exposure to Other Factors (primarily Industries) can account for the bulk of the Mixed portfolio’s underperformance.
Spotlight – correlations
As we noted in our Q1 post, the COVID-19 crisis caused cross-asset correlations to increase, at a time when investors needed diversification the most. The STOXX Factor Indices, on the other hand, saw more differentiation through the crisis, i.e. active correlations across factors moved closer to 0. This can partly be attributed to the focus on increased style purity of the individual factors. We extend our previous chart of average active correlations between factor pairs both forward and backward in time and include the ESG-X factors for this analysis as well (Figure 8).
Figure 8
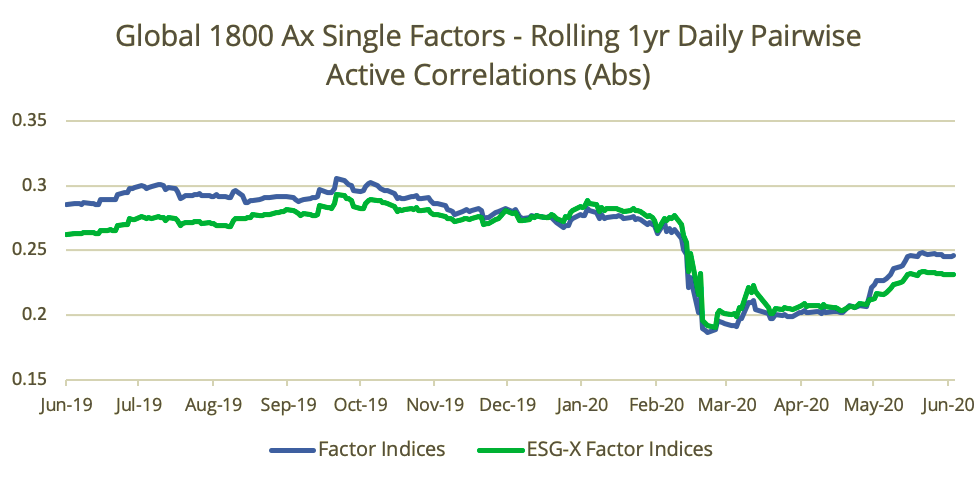
Using the rolling-1yr correlation metric, average active correlations (absolute levels) bottomed out in mid-March, coinciding with the height of volatility in equity markets. Correlations started to rise more markedly in late May, but remain below levels seen throughout most of last year. The main pairings driving increases in absolute correlation levels (i.e. moving further away from 0) were Quality/Value (which became negative), Momentum/Value (turned increasingly negative) and Momentum/Quality (became increasingly positive). We observe minor differences in the average correlations amongst the Factor and ESG-X Factor versions.
Conclusion
With half of 2020 in the books, factor investors have not yet been fully rewarded for staying the course. While some bright spots — for example, Quality and Momentum — exist, the drawdown in Value (and related to it, Size) will continue to test the time horizons, as well as the patience of investors. While signs of a turnaround start to appear in the more beaten-down factors, it is too early to call it a comeback. That said, when performance returns, vehicles that have the objective of targeting high-intended factor exposures, limiting unintended exposures and ensuring overall liquidity should be well placed to capture it.


