

By Frank Siu, Executive Director, Qontigo Index Team
The recent market turmoil stemming from the COVID-19 crisis has inevitably led some investors to draw analogies to the global financial crisis (GFC), with questions being asked about the timing and form of a recovery. Recent reversals notwithstanding, markets are still sharply down. Should we expect to see a risk rally any time soon?
Leveraging Axioma’s Factor Risk Models and the recently launched STOXX Factor Indices suite, we attempt to answer this pressing question by examining relative valuations of global equities at different risk levels, as determined by a variety of model analytics.
Background
In the aftermath of the GFC, starting roughly in March 2009 with small differences in timing across geographies, markets rallied around the world. Particularly noteworthy was the fact that, apart from the broad market recovery, factors and characteristics that were disproportionately sold off during the downturn, namely those associated with risk — i.e., value, low quality, high volatility/risk/beta — rebounded strongly, thus leading to the subsequent characterization as a ‘junk rally’.
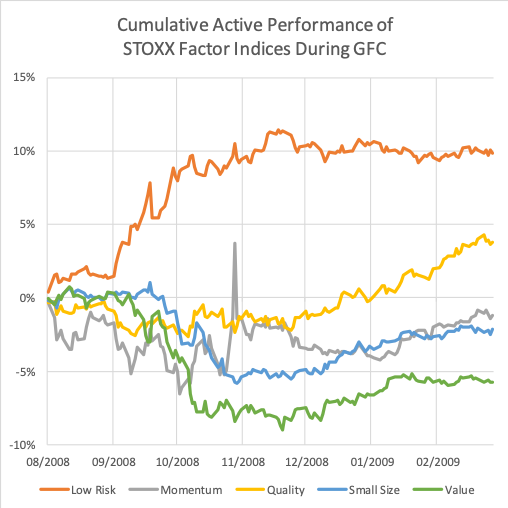
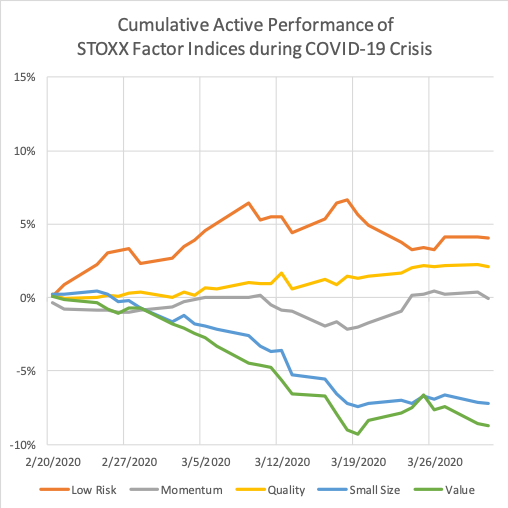
Source: Qontigo. Data prior to index launch simulated
With the benefit of hindsight, it is possible to see how valuation spreads between risky and less risky stocks were at such extremes by early 2009 that a reversal was almost inevitable. We apply a similar lens to the current market conditions, with the goal of enabling investors to make better tactical decisions on factors and markets in the near term.
Valuation spreads using Axioma factors
We begin by comparing stocks along various dimensions typically associated with ‘risk.’
For starters, the STOXX Factor Indices family features a Low Risk single factor index, which defines risk by combining the Market Sensitivity (historical beta) and Volatility (idiosyncratic volatility) factors from the Axioma Factor Risk Models. We also refer to the Size factor index, which uses the Size risk model factor — the general assumption here being that small caps are usually perceived as riskier than larger companies.
In addition to risk model factors (which are based on historical or backward-looking measures), we draw upon forward-looking analytics from the Axioma Factor Risk Models: predicted total risk, predicted specific risk, and predicted beta. Axioma Factor Risk Models are available in four variants — fundamental and statistical; short- and medium-term — so we consider all flavors. The dynamics of the short horizon and statistical models are likely to offer additional responsiveness befitting the current climate, given how quickly markets have been moving.
Finally, we need a yardstick for measuring relative valuations. A rigorous evaluation of different valuation techniques and the accounting nuances behind these methodologies is most certainly beyond the scope of this commentary. Here we will conveniently rely on the corresponding Value factor index, where potentially undervalued stocks are identified using the Axioma Value (book-to-price) and Earnings Yield (both historical and analyst forecast) risk model factors. One additional advantage of using risk model factor exposures is that being standardized z-scores, they are comparable across time without having to worry about big differences in overall stock market valuations during different periods.
For each definition of risk above, we rank equities in the STOXX® Global 1800 Index universe and group them into quintiles, then compute their active value exposures. We do this using data as of present day and several points in time historically.
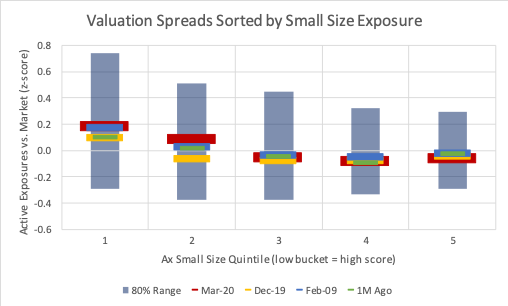
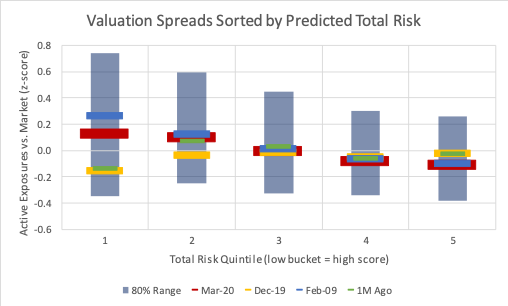
Source: Qontigo. Data prior to index launch simulated.
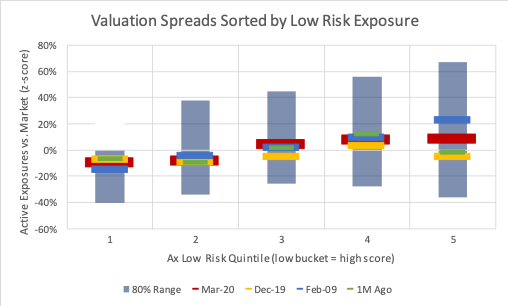
Lower numbered quintiles correspond to higher numerical values. Quintile #1 for Low Risk therefore contains the lowest volatility names, and quintile #5 for Small Size the largest companies. The colored bars indicate valuation levels, measured today (thick red), one month ago (green), 2019 year-end (yellow), and February 2009, immediately prior to the risk rally (blue).
Before drawing any conclusions, it is reassuring to note that along all these dimensions we assume to be associated with riskiness, stocks are generally priced consistently. In other words, the market ‘agrees’ that riskier stocks, irrespective of the model metric, should indeed be cheaper, relatively speaking, reflected in a higher valuation score. Graphically, this is shown by the downward trend in the valuation bars for a given date (reversed for Low Risk). The higher numbered quintiles containing ‘less risky’ stocks, whether it be by capitalization, volatility, or model predicted risks and betas, are almost always more expensive. That said, there is no single view of risk, hence all the plots differ slightly, and a few occasionally exhibit a bit of non-linearity in the ‘middle’ quintiles.
As to the critical question of whether we are at a turning point similar to the one preceding the 2009 risk rally, one’s attention should focus on the red and blue bars. Although markets have nosedived in the past month, it would appear that the sell-off is across all market segments and factors — and unlike the GFC, stocks with riskier characteristics have not been sold off disproportionately.
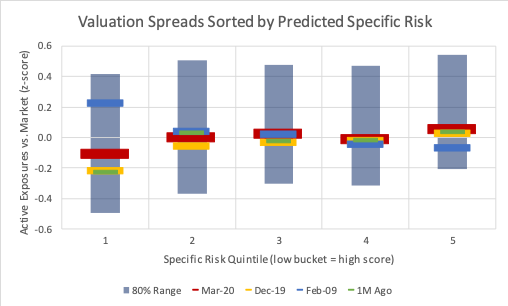
The very extreme ‘stretched’ valuations seen in 2009 are not reflected in the current market (at least not yet!). This is especially true when analyzed using Axioma’s model–predicted total and specific risks, where the 2009 blue bar in the lowest quintile is noticeably higher (cheaper) than anywhere else, either comparing cross-sectionally across quintiles, or across different points in time. The fact that these two metrics are directly related to stocks’ volatilities (as opposed to a metric such as Size) and harness the predictive power of the Axioma model — and thus perhaps more accurately capturing markets’ expectations — lends additional credence to this conclusion.
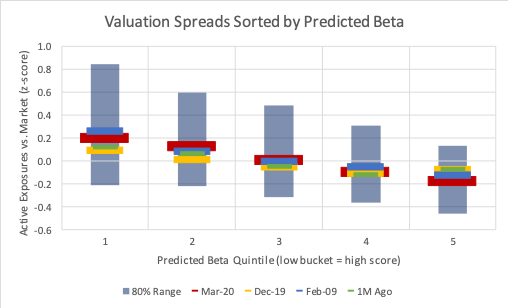
If we follow the market’s movements by looking at valuations from year-end 2019 (yellow) to a month ago (green) to present day (red), along most dimensions there is a clear progression. Risky stocks have been getting cheaper — bars edging upward — but, once again, approaching nowhere near GFC levels. Once again, this is most evident in model-predicted risks, total and specific, with the trend slightly more subdued when examining predicted betas.
Summary
In short, equity prices have plummeted during the recent crisis but, unlike the GFC, the sell-off does not appear to have targeted specific groups of stocks by risk characteristics. Riskier stocks remain cheaper than others. This relationship has not changed materially in recent months and has certainly not been amplified to the very stretched, almost unsustainable, levels witnessed in early 2009. Investors were exceedingly averse to risky stocks then and this does not seem to be the case at present, at least not to the same degree. Given these circumstances, a risk rally similar to the recovery from the GFC, where small, risky, deep-value stocks sharply outperformed, seems unlikely. When a recovery ultimately occurs, factors such as Value, Small Size, and Volatility will almost certainly gain, but perhaps not with the magnitude and speed witnessed in 2009.


