
While investors in US stocks last week had reasons to celebrate, those holding European shares were feeling less cheerful.
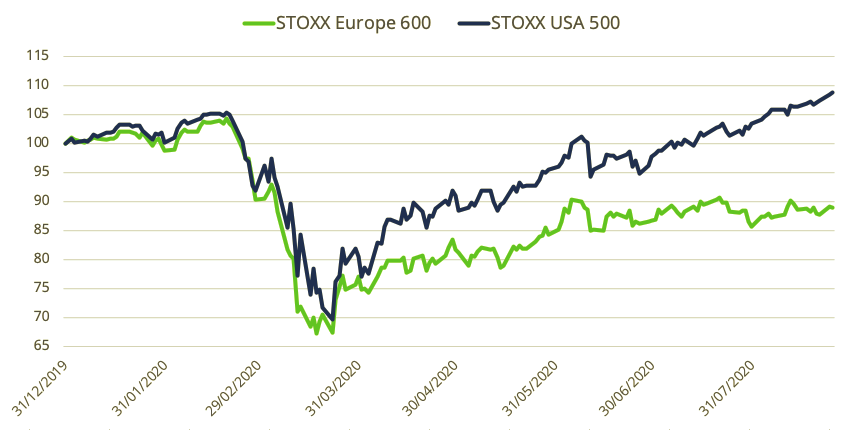
The benchmark STOXX® USA 500 Index on Aug. 19 climbed to a record high, capping a 53% rebound from this year’s low on Mar. 23.1 The STOXX® Europe 600 Index has risen 32% from its low on Mar. 18, and is still 15% below its Feb. 19 all-time high (Exhibit 1).
Exhibit 1 – 2020 Performance
Biggest annual difference on record
US stocks extended the gains in the first two sessions of this week, while European shares were little changed. The STOXX USA 500 is now up 8% this year through Aug. 25, while the STOXX Europe 600 has lost 11.1%. Should such a spread persist until year-end, it would represent the widest annual outperformance on record for the US gauge and the widest difference ever between the two indices.
The recovery in stocks since COVID-19 fears grappled markets in February and March is noteworthy as the world’s economy is still set this year for the widest annual contraction since the 1930s. Helping sentiment, central banks and governments have provided extraordinary support to economies reeling from lockdowns to control the pandemic; and many investors are betting that consumer spending will gather pace as restrictions to everyday life are lifted.
GDP slumps
Several reasons may help explain the stronger performance of US stocks.
Firstly, the American economy, while severely hit by the pandemic, has suffered less than that of most European countries. US second-quarter gross domestic product (GDP) contracted by 9.5% from the year-earlier period, the steepest drop on record. The European Union’s economy, on the other hand, shrunk by an annual 14.1% between April and June, with the UK and Spanish economies contracting by 22%, and France’s by 19%.2
Some analysts say the US government’s stronger financial response to the coronavirus crisis and the country’s comparably flexible markets are behind this economic diferential.3
Seprately, European exporters are also experiencing a headwind of their own. After falling in the first two months of the year, the euro has strengthened 11% against the dollar since Mar. 20, hurting the value of overseas revenues and making European exports less attractive in foreign markets.
Index composition
Last but not least, index composition has been a big determinant of performance. Particularly so, the US exposure’s to a high-growth industry such as technology, which has enjoyed strong momentum this year.
Exhibit 2 shows the weight, return and contribution of 10 industries in the STOXX Europe 600 and STOXX USA 500 indices since the start of this year. The analysis uses Axioma Portfolio AnalyticsTM, so return figures may not coincide with those of STOXX indices.
Exhibit 2 – Industry exposure and contribution
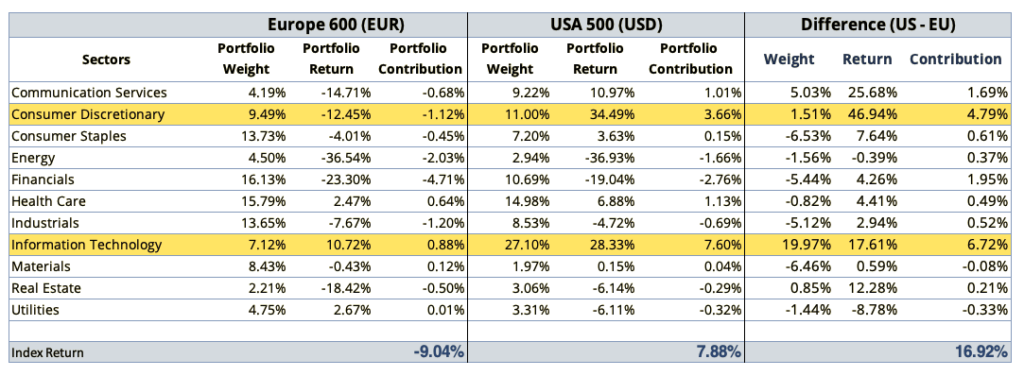
Two industries stand out for their outsized contribution in favor of the US (last column, ‘Contribution’) — Information Technology (IT) and Consumer Discretionary.
While IT accounts for 27.1% of the US index, it makes up 7.1% in the case of Europe. The sector has jumped 28.3% in the US, lifted by strong performances in heavyweights Apple Inc. and Microsoft Corp., which account for a combined 40% of the IT industry in the index. The stocks have rallied more than 50% and 30%, respectively, this year.
In Europe, while IT has been the best-performing sector, it has returned a comparably more muted 10.7%.
For a longer analysis on the weight of technology stocks in this year’s performance of US stocks, please visit a recent blog post, ‘The US market can thank its FAANGs.’
Growth profile
Consumer Discretionary companies have also provided disproportionate returns in favor of the US index this year. The sector in the US has done even better than IT, rising 34.5%, driven by share gains in Amazon.com Inc. In the case of the STOXX Europe 600 Index, the same industry has fallen 12.5% in 2020, hurt by performances in luxury-goods companies and carmakers.
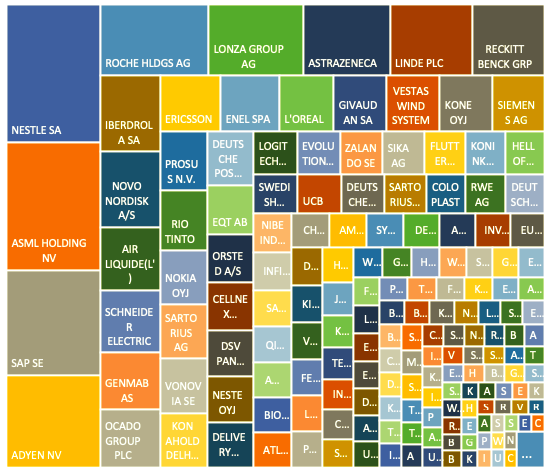
Exhibits 3 and 4 compare the single-stock contribution to positive returns in 2020 for the STOXX USA 500 Index and STOXX Europe 600 Index. Exhibit 3 shows the outsized contribution from four stocks in the US index: Amazon.com, Apple, Microsoft and Tesla Inc. For the European index, single-stock contributions are more evenly spread.
Exhibit 3 – Positive contribution year to date in STOXX USA 500 Index
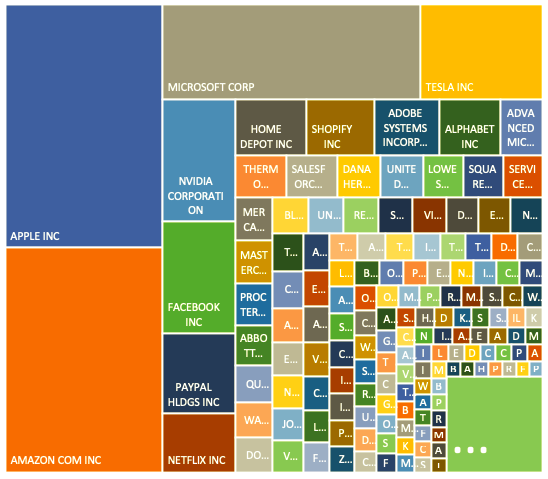
Exhibit 4 – Positive contribution year to date in STOXX Europe 600 Index
Growth vs. value
The large presence in the STOXX USA 500 Index of innovative businesses with above-average earnings ties with a long-held argument that the US is a ‘growth’ market and Europe is ‘value.’ A look at valuations seems to support that argument. The STOXX USA 500 Index is trading at 24 times estimated earnings, compared with a ratio of 19 for the STOXX Europe 600.4
While arguably not very cheap either, Europe could benefit more than the US from a resurgence of the ‘value’ style. A 2019 report accessible here may prove a useful guide for investors seeking exposure to Europe through benchmark indices.
Economic woes
Still, Europe faces a difficult economic environment. IHS Markit said Aug. 21 that its preliminary Eurozone composite purchasing managers index (PMI) slipped to 51.6 in August from 54.9 in July. Even as the number came out above the 50 mark that points to an acceleration in activity, it missed economists’ forecasts for a 55.3 reading.5
“Positive effects from reopening economies are fading out in the service sector, confirming that the recovery will not be V-shaped,” Bert Colijn, Senior Eurozone Economist at ING, wrote in a note to investors after the PMI report was released.6
Featured indices
STOXX® Europe 600 Index
STOXX® USA 500 Index
1 All results are price returns before taxes through Aug. 19, 2020, unless specified. STOXX Europe 600 Index returns are expressed in euros, while those of the STOXX USA 500 Index are in dollars.
2 Preliminary data, Eurostat, Aug. 14, 2020.
3 See Dalibor Rohac, ‘Why Europe’s Chances of a Strong Economic Recovery Are Slimmer than the U.S.’, National Review, Jul. 22, 2020.
4 Projected price-to-estimated-earnings excluding negative readings. Source: STOXX factsheets.
5 MarketWatch, ‘’Companies remain cautious’ as eurozone flash PMI eases to two-month low,’ Aug. 21, 2020.
6 ING Think, ‘Eurozone PMI slows markedly in August,’ Aug. 21, 2020.